
ID Technical Outlook
The ID chart shows that the price has tested the upper border of the descending channel it has been trading in for a long period on a daily timeframe. This is the fourth test to the upper border so far. ID is currently trading around the level of $0.2004, which coincides with the upper trendline of the falling channel and the key resistance zone of $0.1900–$0.1984. If the price can break above this zone, it will be a signal for strong momentum technically.
Following a breakout from here, the level around $0.2524–$0.2635 could stand out as a resistance. Remember that this resistance zone worked as a strong sell area in the past and it represents the first medium-term target for the channel pattern.
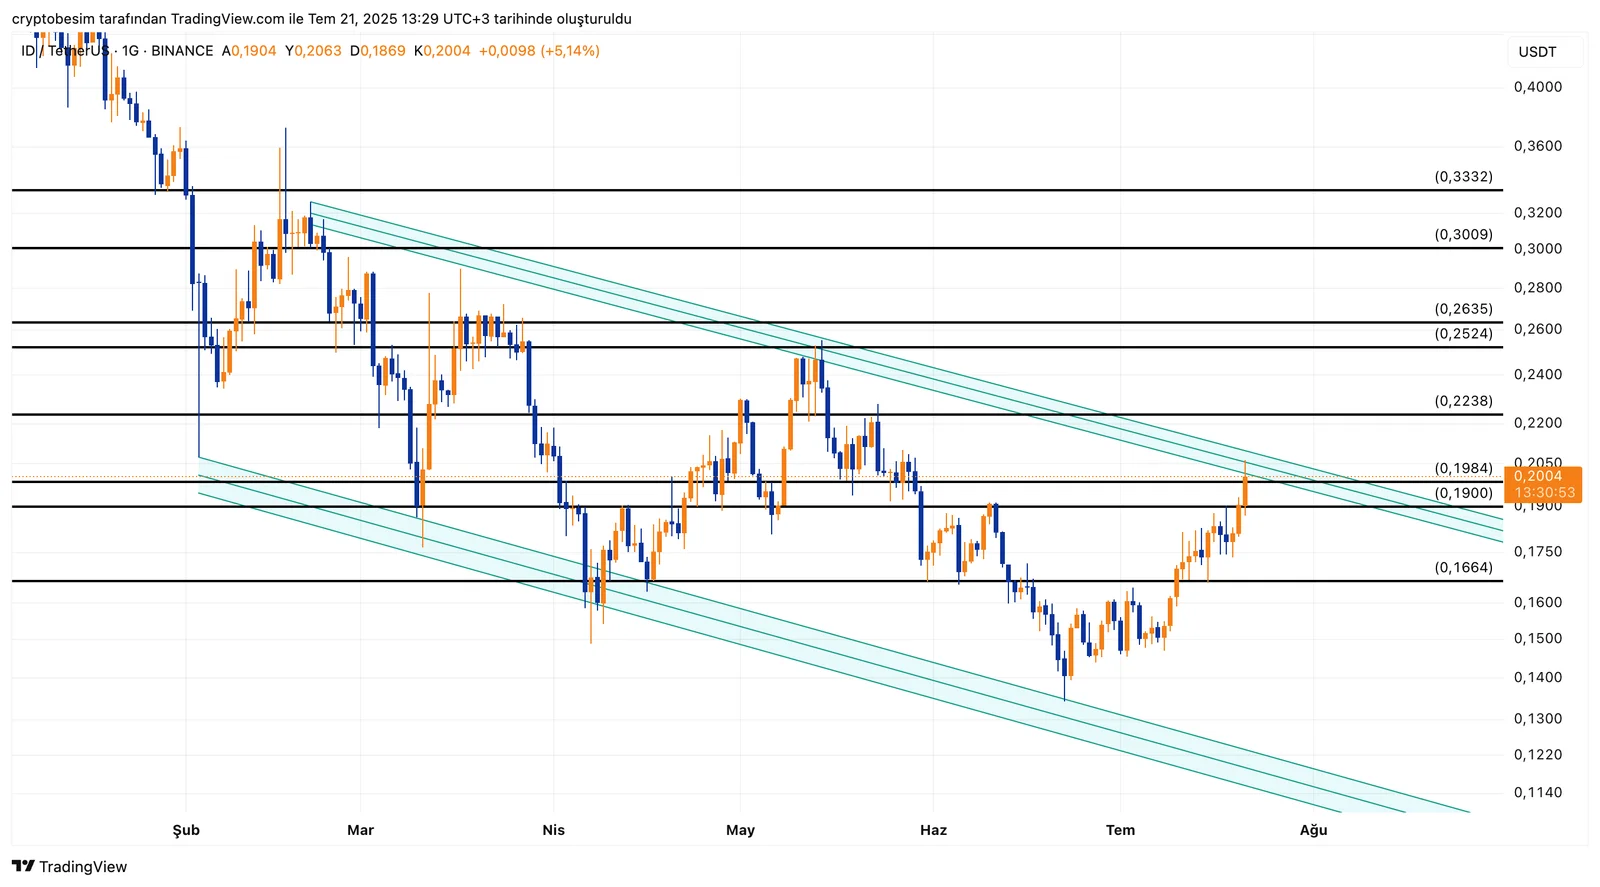
On the other hand, we should be following the support levels at $0.1900 and $0.1664 in case of a price pullback. Price dropping below $0.1900 could trigger a new downward movement within the channel.
Summary:
- Price: $0.2004, Resistance zone: $0.1900–$0.1984 breachedFourth test to the upper border of the channel doneThe first target is $0.2524–$0.2635 in the event of an upward breakoutThe target of the channel breakout is: $0.30–$0.31Support levels to follow in case of a pullback are: $0.1900 → $0.1664
These analyses, not offering any kind of investment advice, focus on support and resistance levels considered to offer trading opportunities in the short and medium term according to the market conditions. However, traders are responsible for their own actions and risk management. Moreover, it is highly recommended to use stop loss (SL) during trades.


