
EDU Technical Analysis
Looking at the EDU chart, we see that the price has broken above the falling wedge formation. After the breakout, retest has been done properly and the price has exceeded the range between $0.148–$0.156 slowly. Holding above this level can be considered positive. The target of the falling wedge formation is the level of $0.216, but before surging to this level, there is the resistance level of $0.184. We should be following the target area of $0.216–$0.229, which is also the resistance level ahead.
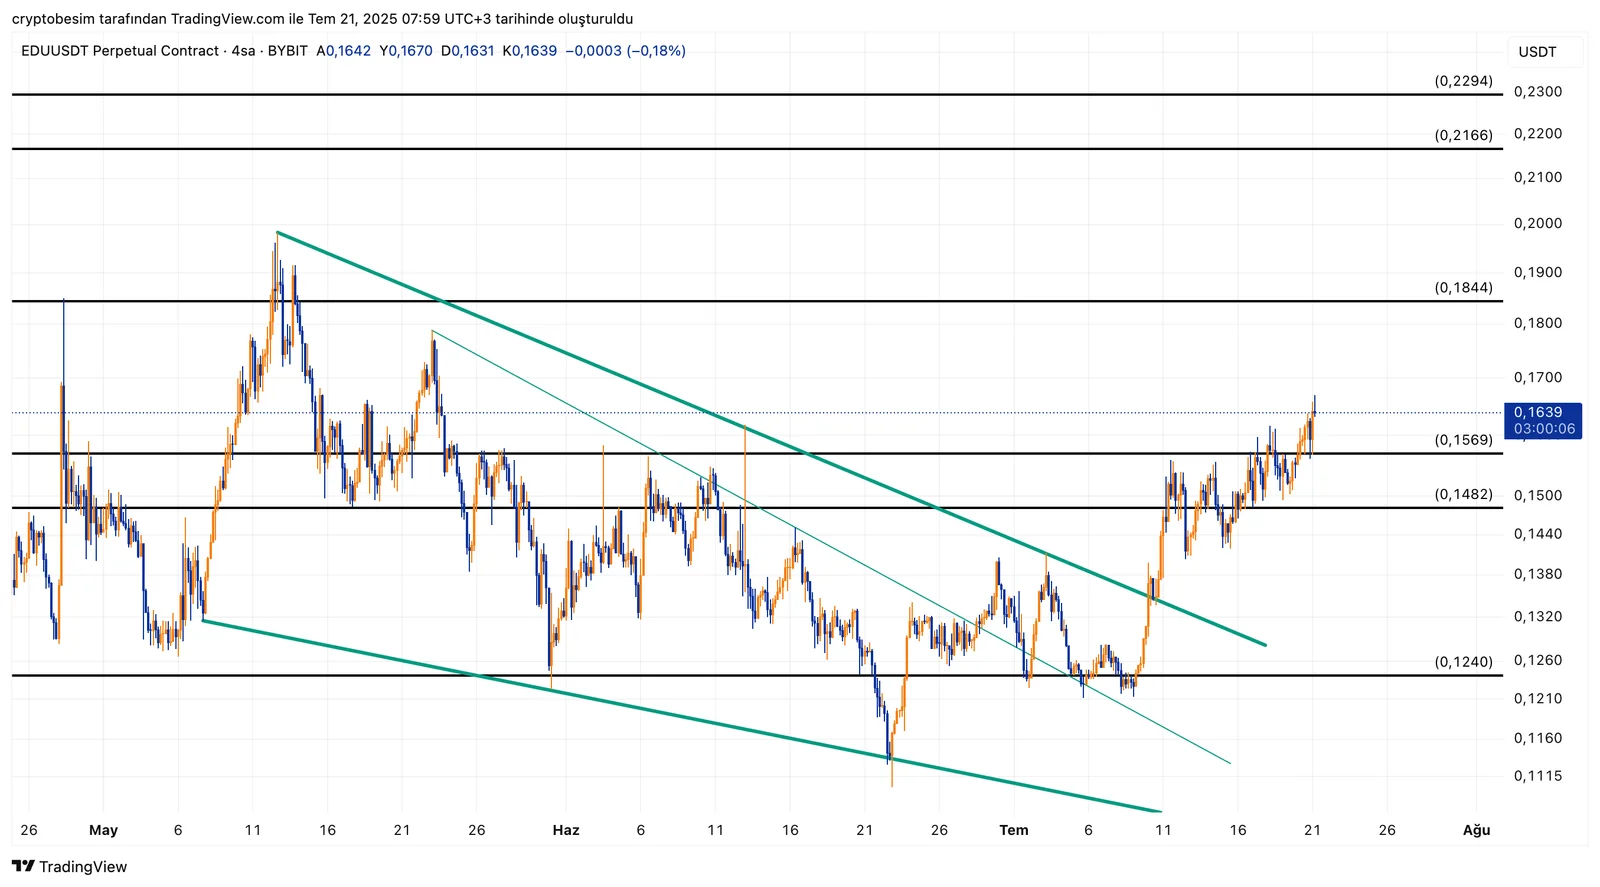
If EDU cannot exceed the current level, $0.148 stands as a key level. Below it, the support level of the falling wedge formation and the horizontal zone at $0.142 could work as support.
These analyses, not offering any kind of investment advice, focus on support and resistance levels considered to offer trading opportunities in the short and medium term according to the market conditions. However, traders are responsible for their own actions and risk management. Moreover, it is highly recommended to use stop loss (SL) during trades.


