
FET Technical Analysis
Looking at the FET chart on a daily frame, we clearly see that there is a properly working descending channel since the beginning of 2024.
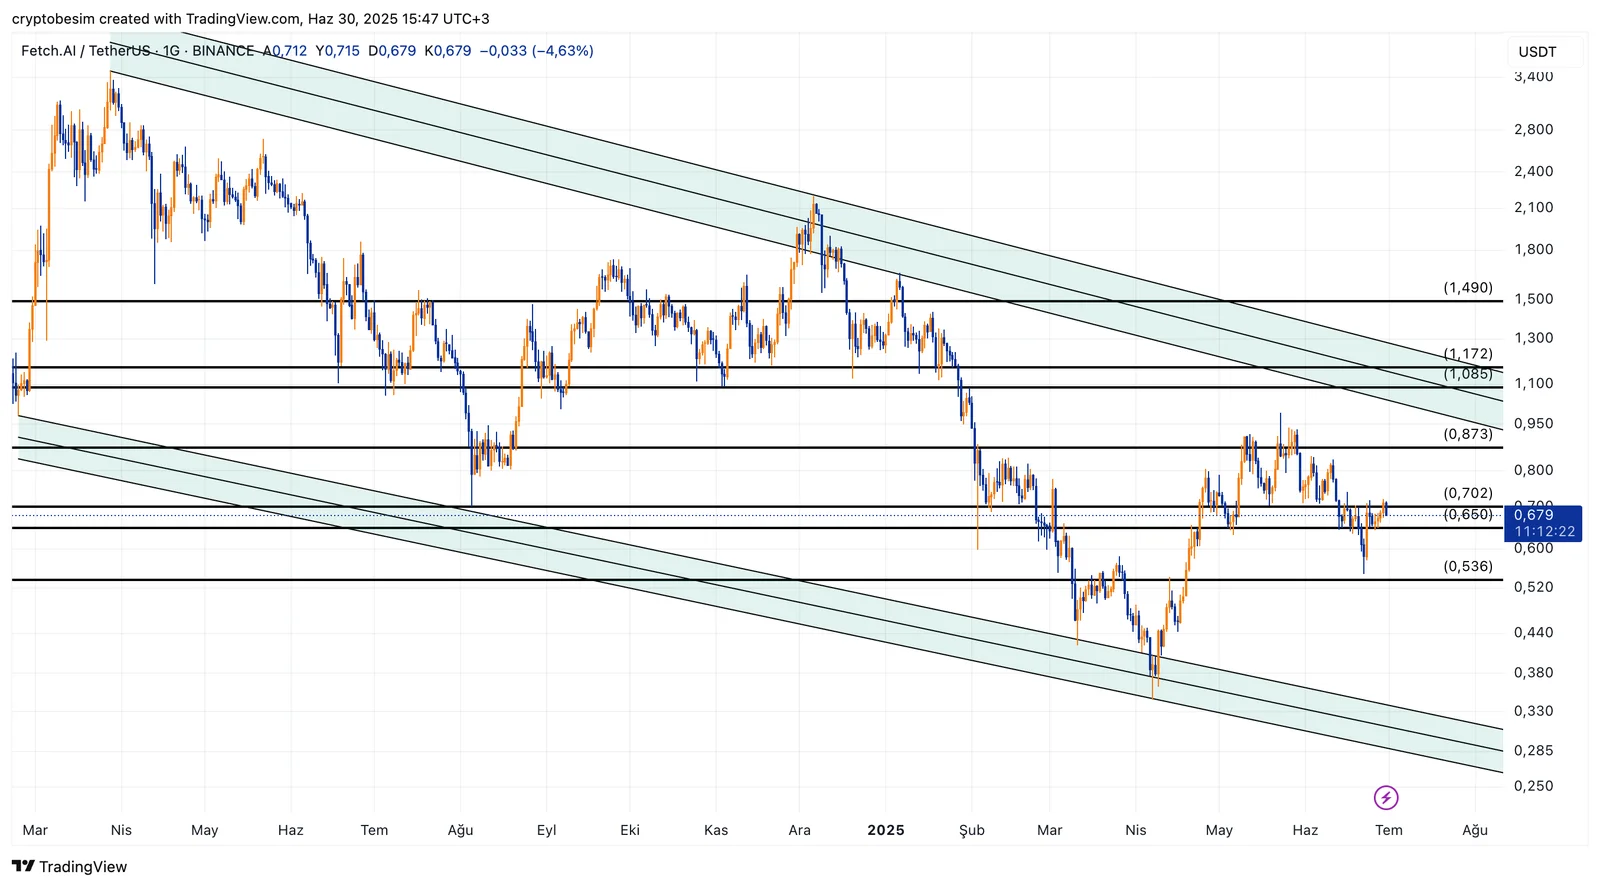
An important support area is $0.65 - $0.70, and the price is trading in the middle border of this descending channel. FET, having previously received an upward reaction from this region, is currently trading in the same area. If the price closes daily below the important level of $0.65, it can first pull back to the level of $0.53 and later to the channel trend support level of nearly $0.33.
In order to talk about the level of $0.87, we need to see price closings above the level of $0.70 in terms of upward movements. Above this level, $0.87, we have the trend resistance level of $1.00 which is the target. Technically, it is highly possible that the price will break above the trend after the next test to it.
These analyses, not offering any kind of investment advice, focus on support and resistance levels considered to offer trading opportunities in the short and medium term according to the market conditions. However, the user is responsible for their own actions and risk management. Moreover, it is highly recommended to use stop loss (SL) during the transactions.


