
ETH Technical Analysis
On the Ethereum side, the current focus is on the upcoming major options expiry. Along with BTC, a large number of ETH options contracts are expiring, and the market is positioned around critical price levels. These types of periods usually stand out with increased volatility and clearer direction. Let’s look at how this options-driven compression is reflected in the technical chart.
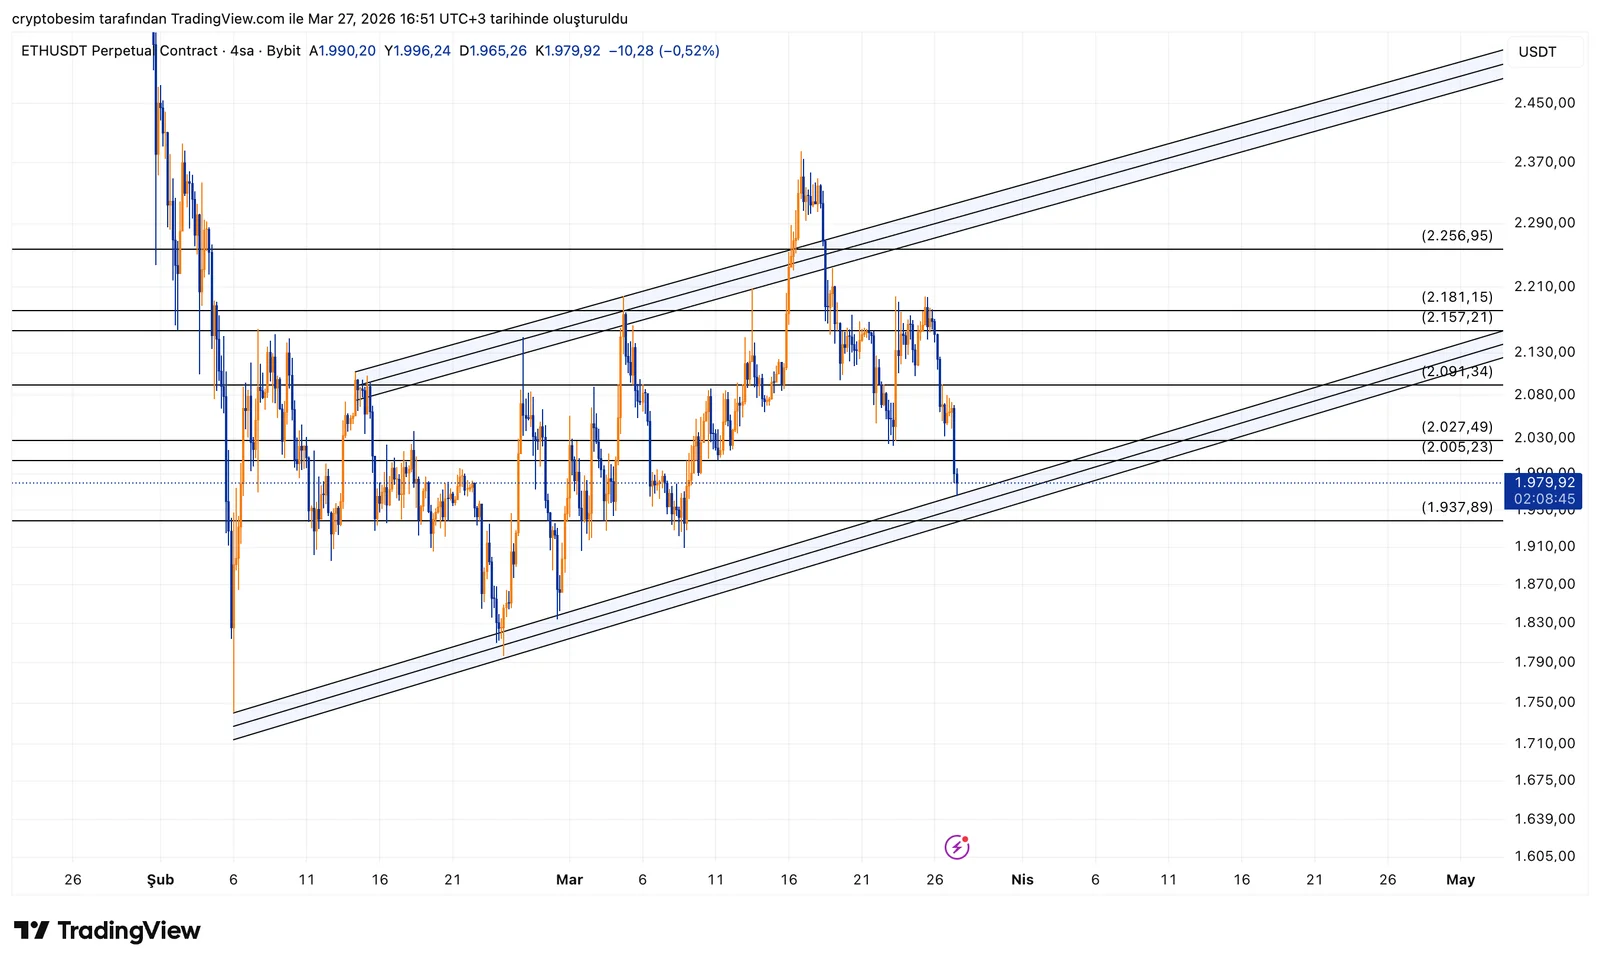
After the liquidity around the 2020$ region was cleared, price moved down and touched the trendline. The 1937$ level has become a critical threshold, as it aligns both with a horizontal support and the lower band of the rising structure.
At the moment, price is trying to hold just above this region. This means the market is making a decision here. If this area holds, the current structure remains intact and the possibility of an upward reaction continues.
However, this is also the key breakdown point. If price drops below 1937$, especially with a loss of the trendline, this move would not remain just a pullback. A new short-term bottom search would begin at lower levels.
On the upside, during initial recovery attempts, attention shifts back to the 2100$ region. This area previously acted as a reaction zone and resistance.
- As long as price stays above 1937$ and the trendline, upward reactions continue
- Below 1937$ and with a trend break, selling pressure accelerates
- In this scenario, a new short-term bottom search begins
- On the upside, the first target is the 2100$ region
These analyses do not provide investment advice and focus on support and resistance levels that are considered to offer short- and medium-term trading opportunities depending on market conditions. However, responsibility for execution and risk management lies entirely with the user. In addition, the use of stop loss is strongly recommended.


