
ETH Technical Analysis
On the ETH side, a clear touch of the 0.618 Fibonacci region and a subsequent reaction are observed. This indicates that the current decline has at least slowed down in the short–to–medium term.
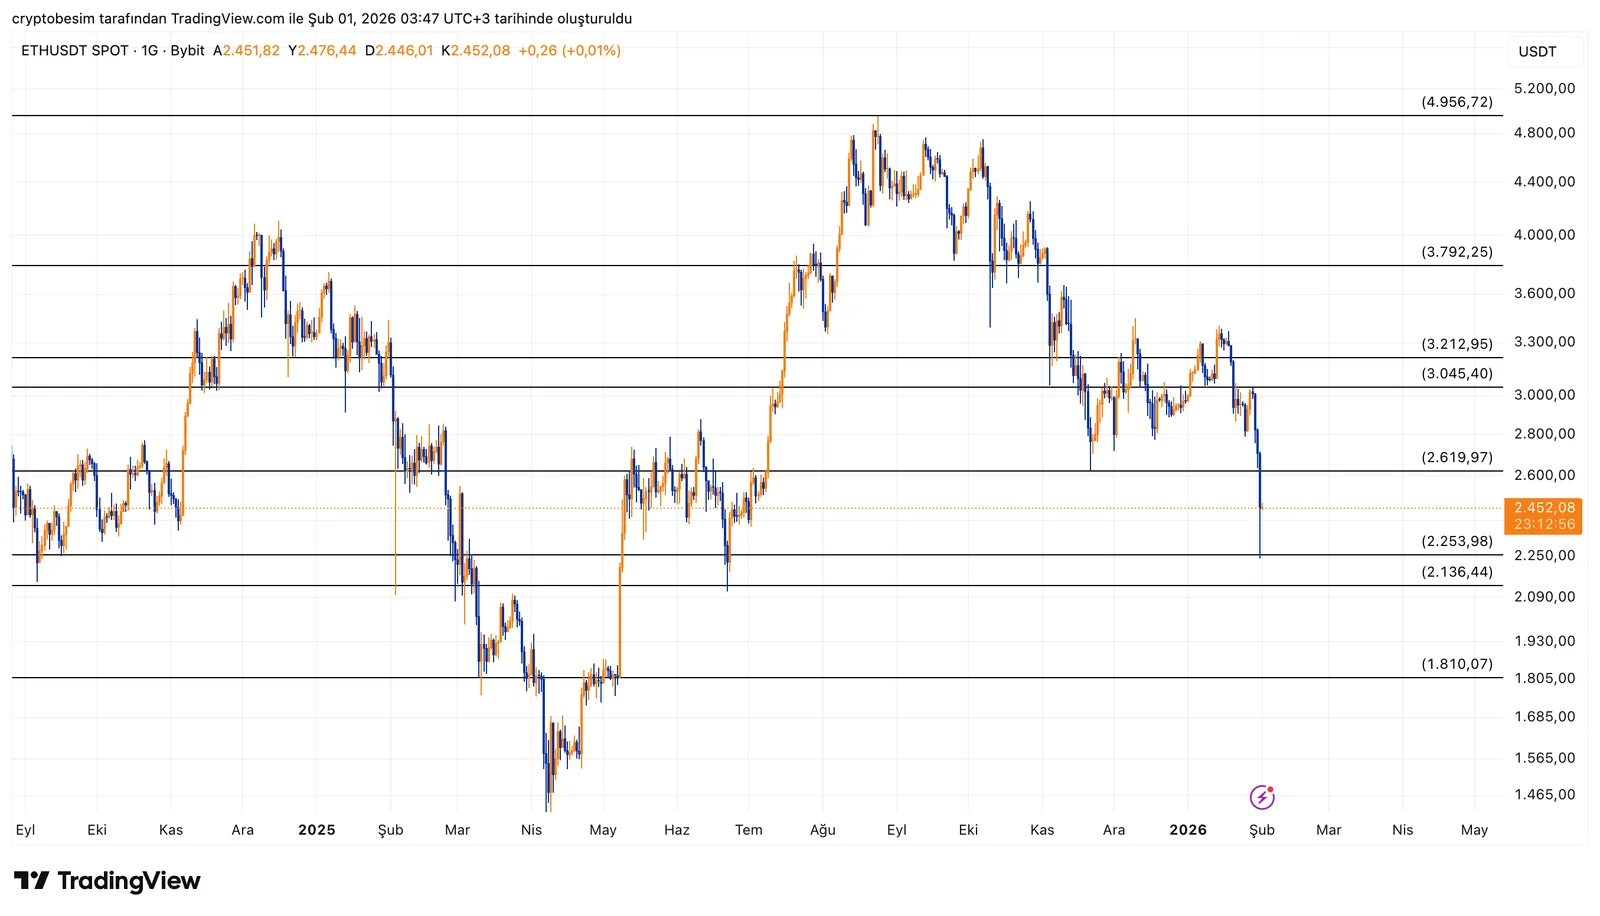
The 2136 – 2253 dollar band is currently the critical support area. As long as the price stays above this region, the upside probability remains stronger. In this scenario, the 2619 dollar level stands out in the first stage. If this region is surpassed, the move is expected to expand toward the 3045 – 3212 dollar band.
On the downside risk side, if sustainability below 2136 dollars occurs, the structure weakens and the possibility of a deeper correction comes into play.
In summary;Above 2136 – 2253 → reaction and upside reversal probability is highTargets: 2619 → 3045 / 3212Below 2136 → structure weakens
These analyses, which do not provide investment advice, focus on support and resistance levels that are thought to create short- and medium-term trading opportunities depending on market conditions. However, the responsibility for trading and risk management belongs entirely to the user. In addition, it is strongly recommended to use stop loss for the positions shared.


