
ETC Technical Analysis
Ethereum Classic has begun 2026 in a quiet but steady way. Price volatility is low, but many investors still trust this old-school Proof-of-Work blockchain. ETC continues to hold a place in some long-term portfolios as it is often seen as the “unchanged version of Ethereum,” For this reason, it can be useful to look beyond short-term price moves and consider the project’s long-term position as well.
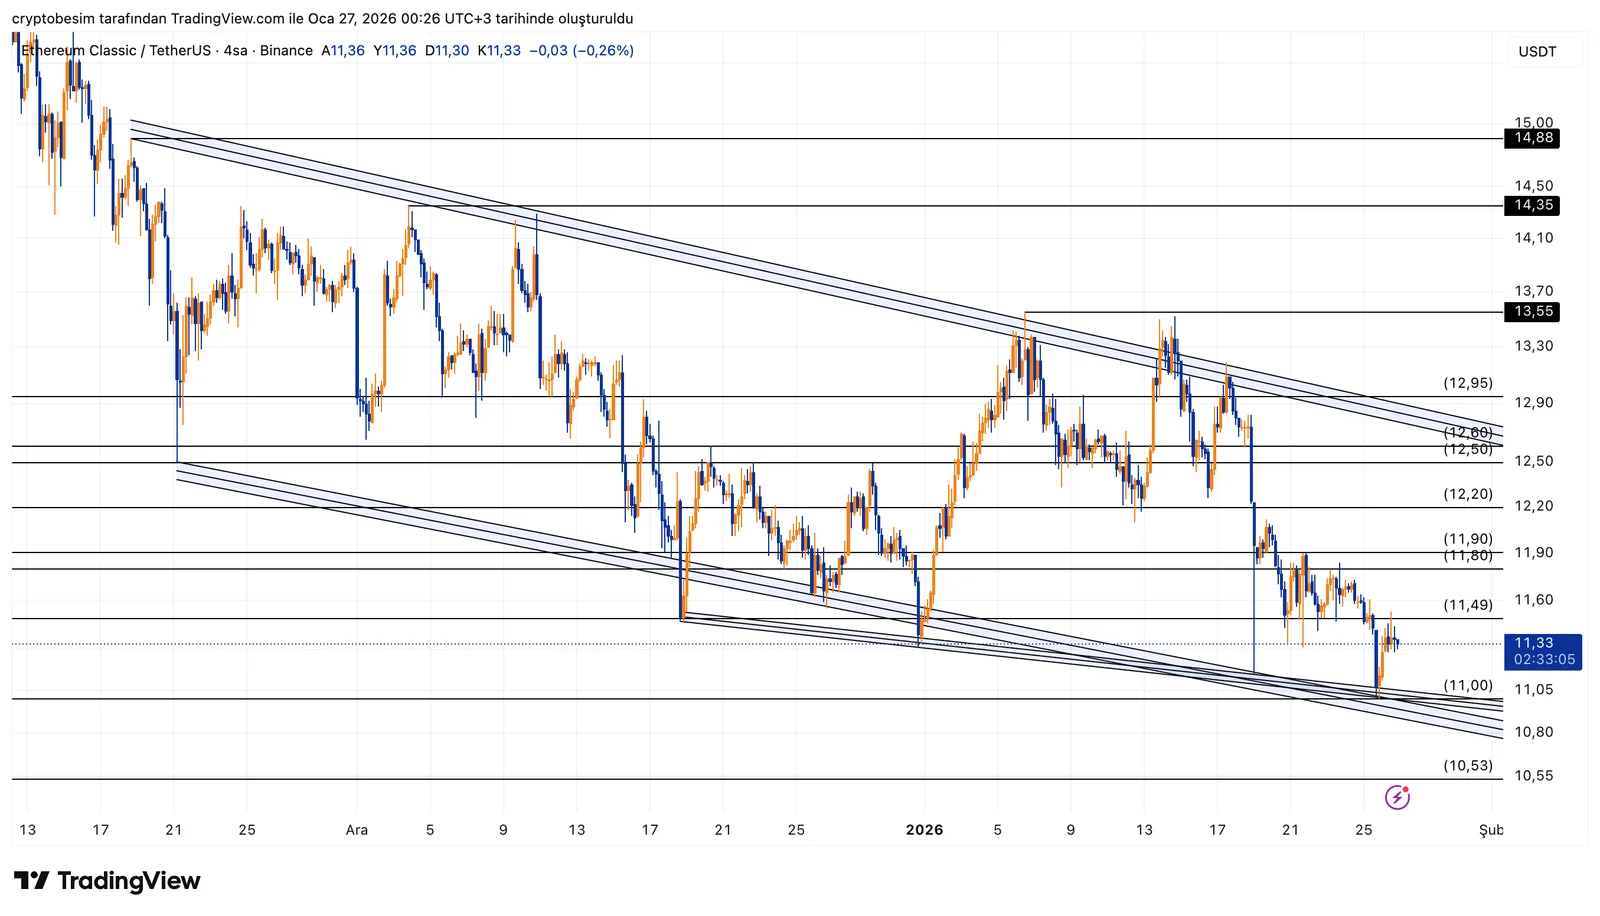
Analyzing the chart, we see that the coin is clearly moving inside a descending parallel channel, and this structure is still valid. Price is trading close to the lower boundary of the channel, and upside reactions remain weak for now.
- Current price: around $11.33
This level acts as a minor short-term support, but the key support zone is $11.00 - $10.80.
This area aligns with the lower boundary of the channel. If broken, the next major support is $10.53.
Resistance levels
- $11.49 – $11.80 zone. This is the first important resistance area. It works as both a horizontal resistance and a short-term reaction zone.A healthy reversal is unlikely unless it holds above it.
- $12.20 is the next level of resistance.
- $12.50 – $12.95 zone. This zone is critical as it matches the upper boundary of the descending channel, making it a key trend-changing level.
Summary :
A short-term bounce remains possible as long as the $11.00 – $10.80 support zone holds; yet, the main trend is still bearish. Unless price breaks above $12.95, the descending channel structure remains technically intact.
These analyses, not offering any kind of investment advice, focus on support and resistance levels considered to offer trading opportunities in the short and medium term according to the market conditions. However,traders are responsible for their own actions and risk management. Morover, it is highly recommended to use stop loss (SL) during trades.


