
ETC/USDT Technical Overview
Ethereum Classic is getting attention again. Recent network upgrades now burn a portion of transaction fees, making the chain more sustainable. Plans to move toward community-based governance are also boosting interest in ETC. These improvements are starting to show in the price charts.
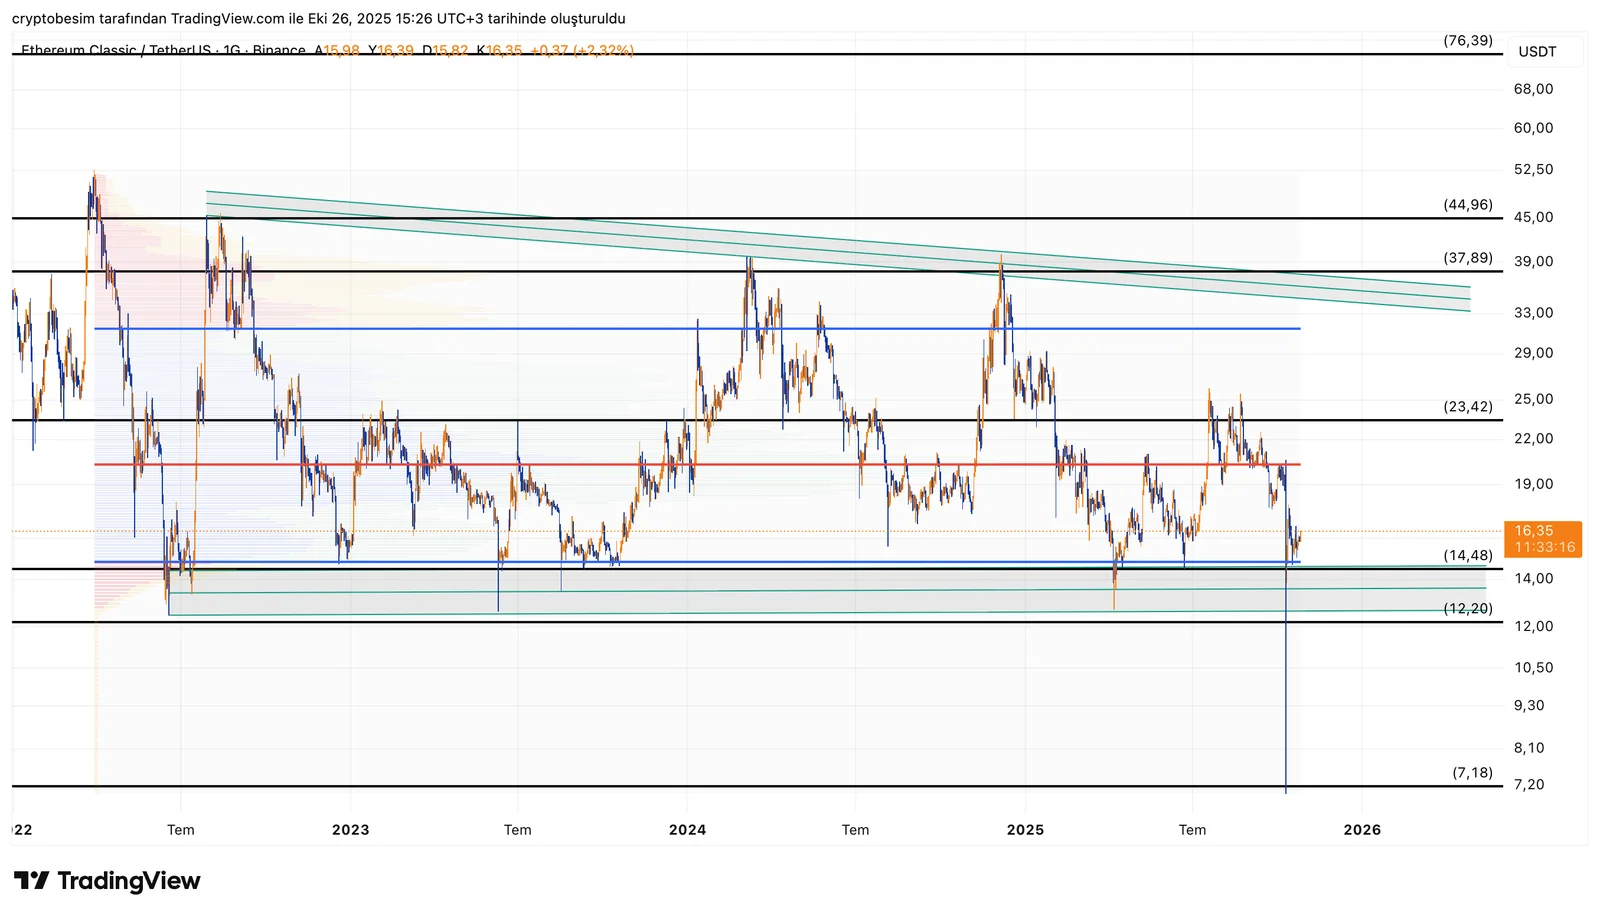
Analyzing the chart, we see that ETC has been trading sideways for a long time, between $14.48 and $23.42. The price of the coin is now near the bottom of this range, where the horizontal support meets an uptrend line. This zone has brought strong buying reactions in the past.
As long as ETC stays above $14.48, there’s potential for a rebound move. Upside targets are $18.50 first, then $19.80. For a trend reversal, ETC needs to break above $23.42 and hold there. If that happens, $37.89 and higher could become possible in the medium term.
However, if $14.48 support breaks, selling pressure may increase, and the price could drop toward $12.20.
- Support Levels: $14.48 → $13.20 → $12.20
- Resistance Levels: $18.50 → $19.80 → $23.42 → $37.89
In summary:
- ETC is trading near a major support zone at the bottom of its range.
- Holding above $14.48 keeps the bullish rebound scenario alive.
- A break below that level could trigger more downside.
- A close above $23.42 would confirm a trend reversal and open the way toward $37.
These analyses, not offering any kind of investment advice, focus on support and resistance levels considered to offer trading opportunities in the short and medium term according to the market conditions. However, the user is responsible for their own actions and risk management. Moreover, it is highly recommended to use stop loss (SL) during the transactions.


