
ENA/USDT Technical Outlook
When we analyze the ENA chart, it is clear that a handle formation has begun to develop following the formation of a wide cup pattern. It is widely known that such patterns usually signal a strong trend continuation once a breakout occurs.ENA is currently trading around the level of $0.58. The handle area is forming between the levels of $0.55 and $0.62. As long as the price consolidates within this range, the pattern remains healthy, and the likelihood of a bullish breakout increases.According to a bullish scenario, it is crucial that the price breaks above the resistance level at $0.67. Above this resistance, the price could surge to $0.74 and then test the mid-term target at $0.85. If the breakout is confirmed, the pattern suggests a potential larger move toward the $2–$3 zone in the medium term.However, $0.55 stands as the most important support level. Losing this level could trigger a pullback toward $0.49 and possibly $0.42.
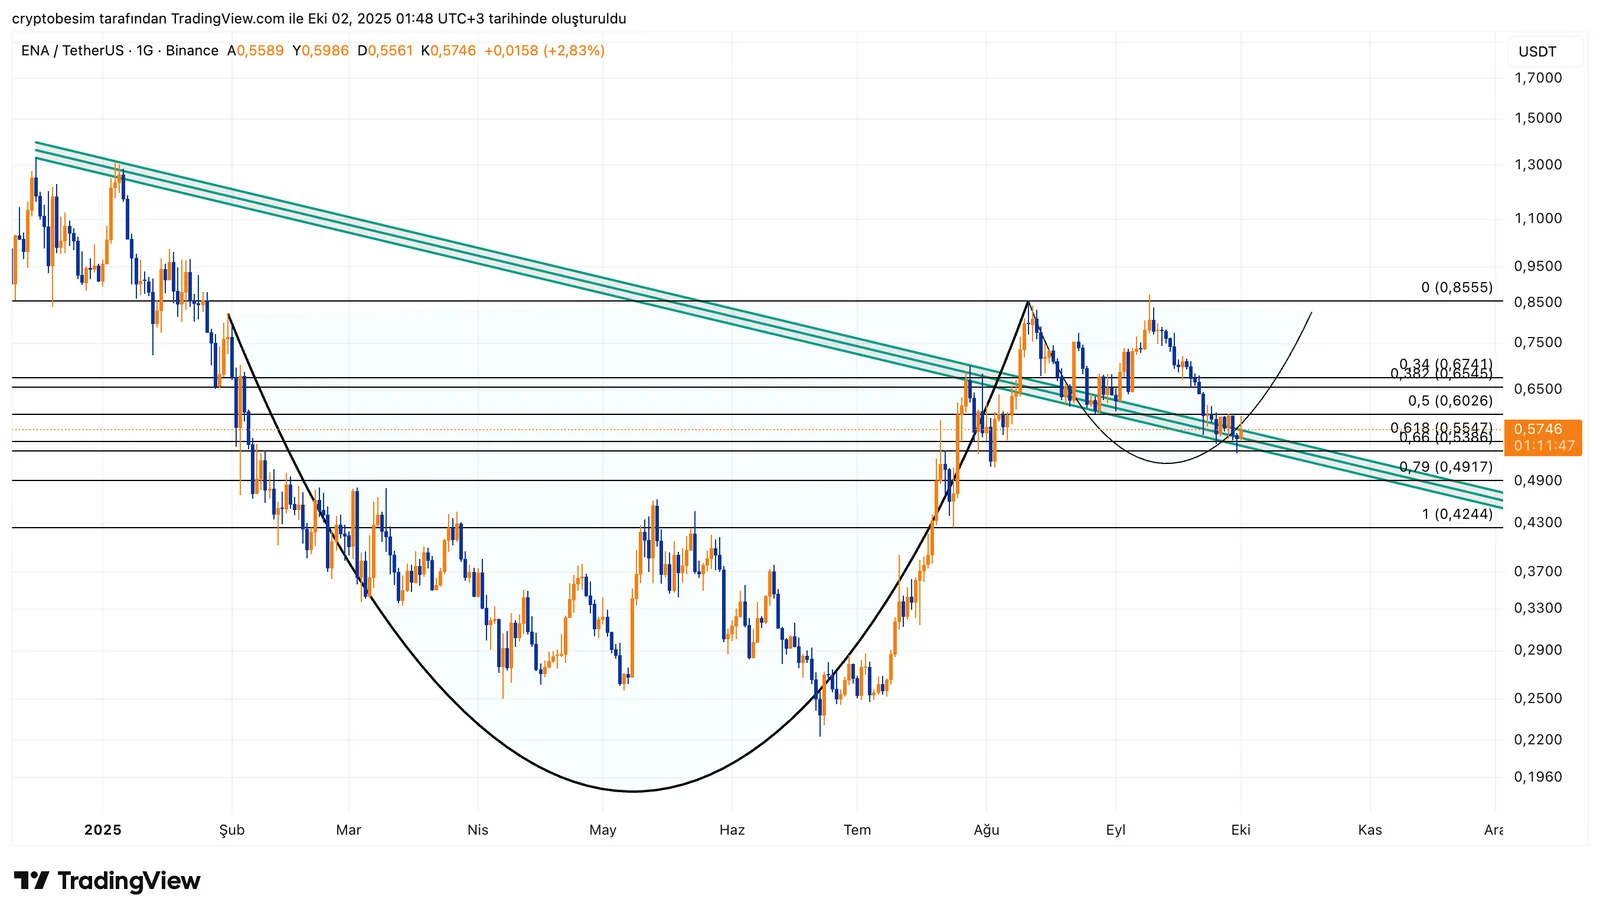
Key Levels to Follow:
- Support levels: $0.55 → $0.49 → $0.42
- Resistance levels: $0.67 → $0.74 → $0.85 → $1.10–$1.15


