ENA/USDT Technical Analysis
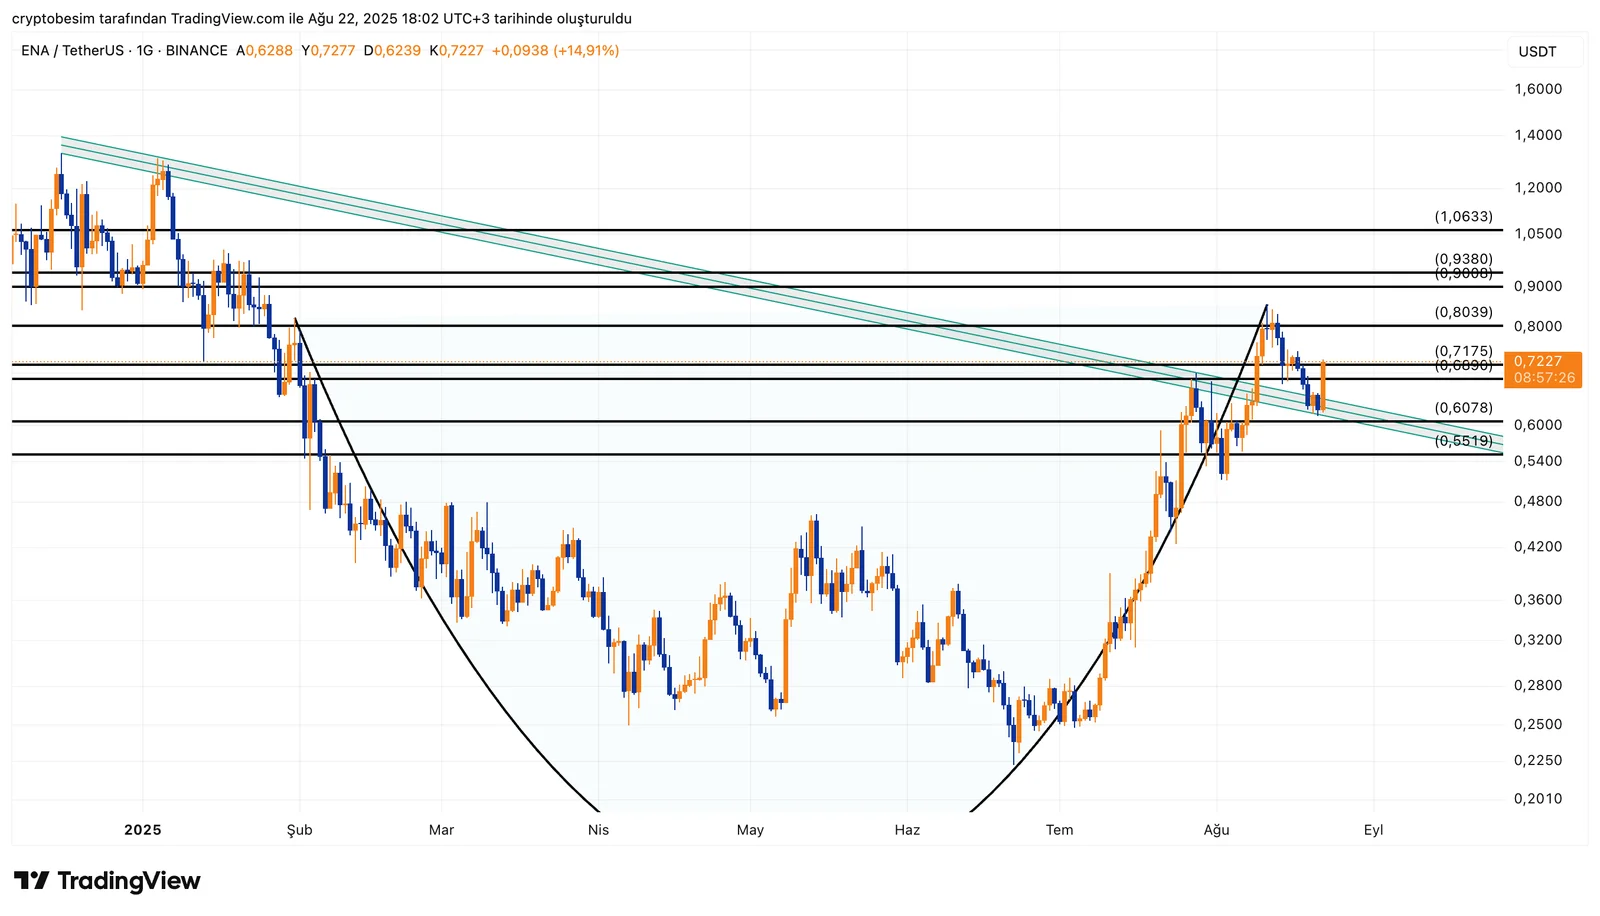
Analyzing ENA chart, we can see that the long-term downtrend has been broken above, as mentioned in the previous ENA analysis. After that, the price pulled back, completed the retest, and made a strong bounce. After the retest, the upward move gained momentum.
The coin is currently trading around $0.72 and testing its first short-term resistance. If this level gets broken above, the price could swiftly move toward $0.80. Holding above $0.80 would open the way to the $0.93–$0.95 area, and later the psychological $1.00 resistance.
On the downside, the first support is at $0.66, while the main defense zone is between $0.60–$0.62. This zone is strong because it is both a retest area and a horizontal support. As long as the price stays above this region, the bullish structure will remain intact.
ENA has confirmed its breakout and retest, showing that the bullish potential may continue in the medium term.

Summary:
- Market structure turned positive after the trend breakout.
- Current price: $0.72
- Support levels: $0.66 → $0.62 → $0.60
- Resistance levels: $0.72 → $0.80 → $0.93 → $1.00
- Retest confirmed, bullish scenario remains strong.
These analyses, not offering any kind of investment advice, focus on support and resistance levels considered to offer trading opportunities in the short and medium term according to the market conditions. However,traders are responsible for their own actions and risk management. Morover, it is highly recommended to use stop loss (SL) during trades.


