
EIGEN Technical Analysis
There is a clear symmetrical triangle formation on the EIGEN chart. The price of the coin seems stuck between lower highs and higher lows. Such patterns usually lead to sharp moves in the breakout direction.EIGEN is currently trading around the level $1.29. We have the level $1.20 as the lower border of the triangle formation. This level seems to be the most important short-term support. The triangle pattern will remain valid as long as this support holds. However, the price could go down to the support levels $1.12 and $0.92 below if we see a breakdown.$1.45 seems to be the first strong resistance level according to a bullish scenario. EIGEN may test $1.75 and then $1.87 if the price breaks upward. The final target of this formation is $2.30.In short, EIGEN is approaching the final phase of the squeeze. The breakout direction from this triangle is likely to determine the medium-term trend.
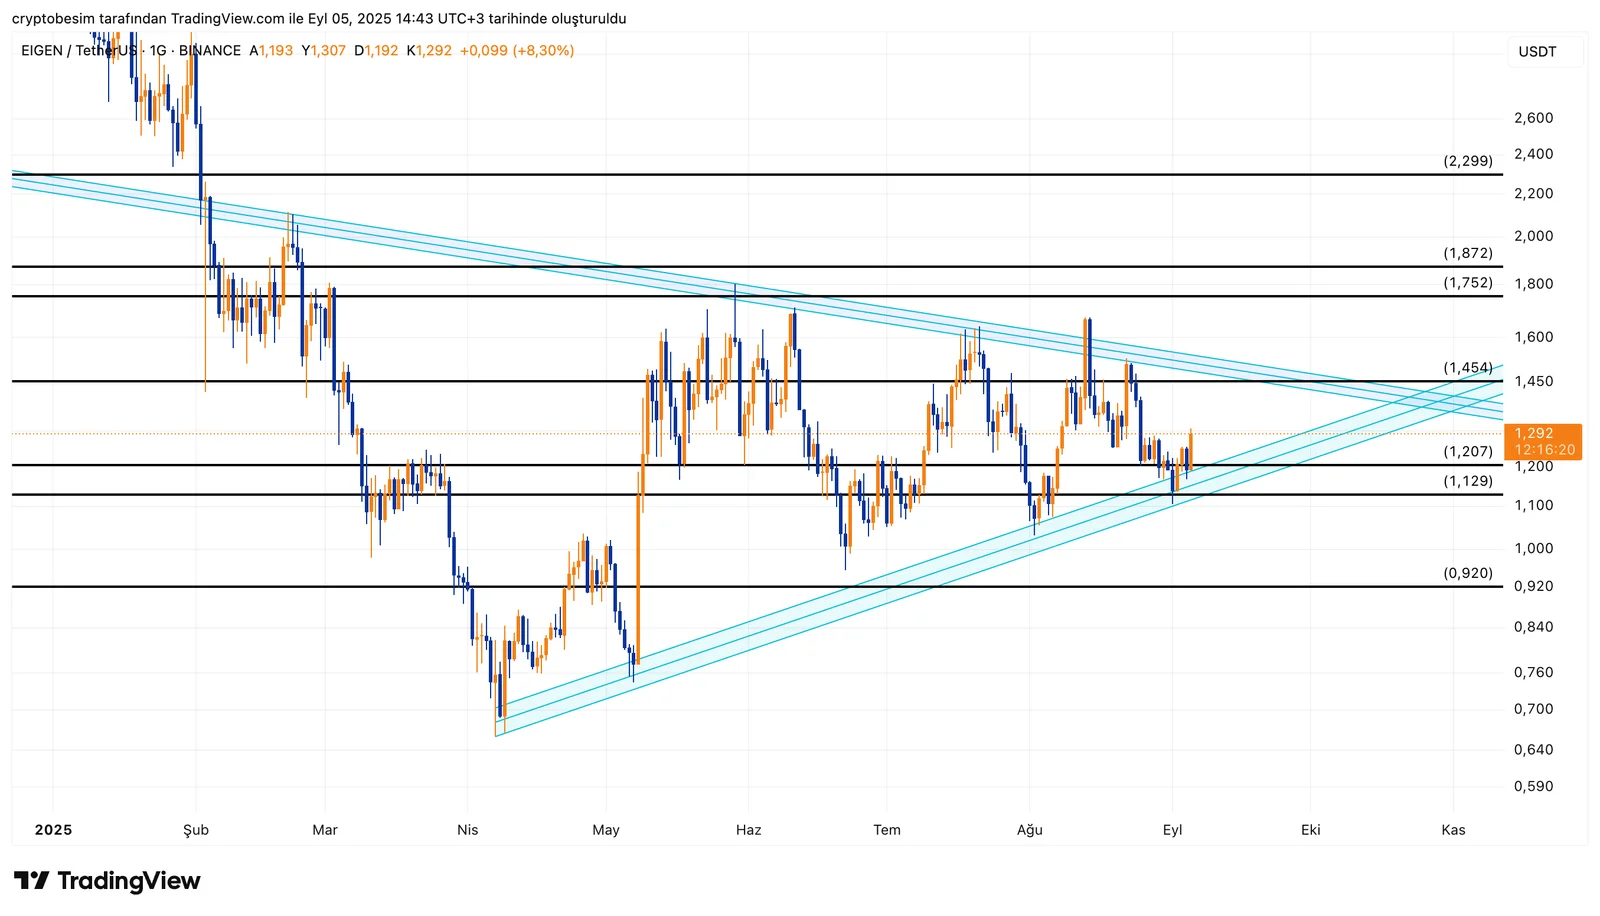
Key levels to watch:
- Support levels: $1.20 → $1.12 → $0.92
- Resistance levels: $1.45 → $1.75 → $1.87 → $2.30
These analyses, not offering any kind of investment advice, focus on support and resistance levels considered to offer trading opportunities in the short and medium term according to the market conditions. However, the user is responsible for their own actions and risk management. Moreover, it is highly recommended to use stop loss (SL) during the transactions.


