
EDU/USDT Technical Analysis
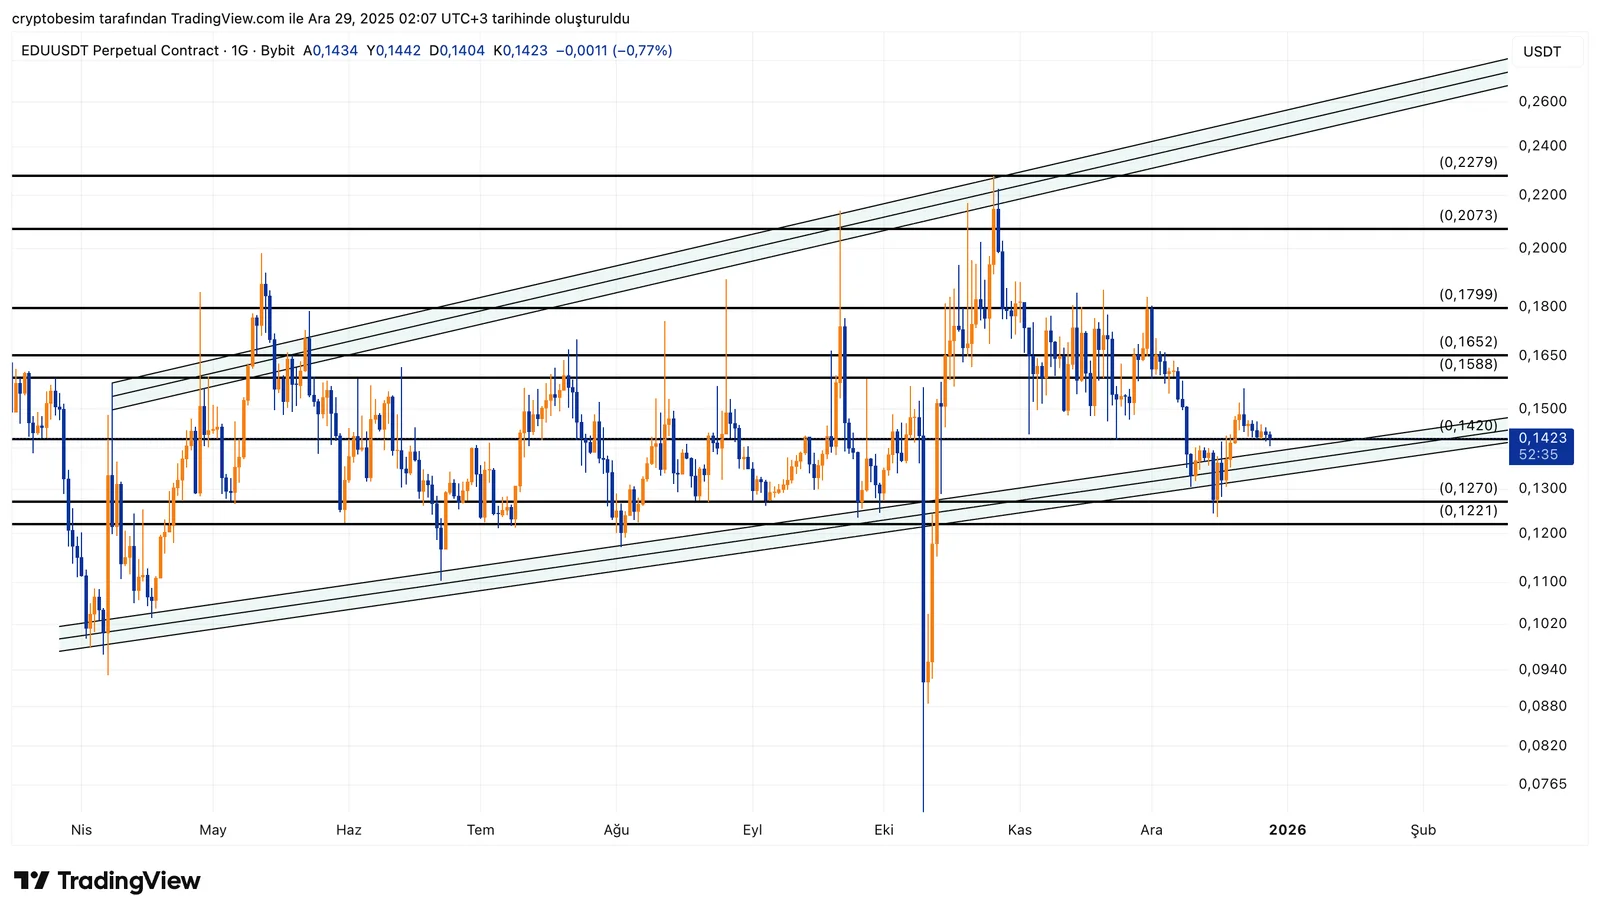
On the EDU chart, the overall structure is clearly moving within an ascending channel, and the price is currently touching the lower band of the channel, which is the trend support. Since this area has worked several times before, it is a technically important decision point. The reactions coming from here will determine whether the ascending structure will continue or not.
In the short term, the 0.135–0.14 band is in a critical support position. As long as the price stays above this region, the current ascending channel is not considered broken. If holding continues here, first the 0.158–0.165 range and then the 0.18–0.20 band, which is the mid-upper region of the channel, become targets again. Especially closes above 0.165 indicate that momentum has started to turn upward again.
However, if this trend support is clearly lost, the situation changes slightly. In such a scenario, the price exits the channel and a pullback risk toward the 0.127–0.122 region emerges. Since this area overlaps with both horizontal support and previous lows, it acts like a final defense line on the downside.
These analyses, which do not provide investment advice, focus on support and resistance levels that are thought to create short- and medium-term trading opportunities depending on market conditions. However, the responsibility for trading and risk management belongs entirely to the user. In addition, it is strongly recommended to use stop loss for the positions shared.


