
Cetus
CETUS has attracted attention in recent weeks with its impressive price action.The upward wave that started from $0.0780 almost tripled the price in a short time, reaching as high as $0.2617.With this rally, a significant transformation occurred both in technical indicators and investor sentiment.
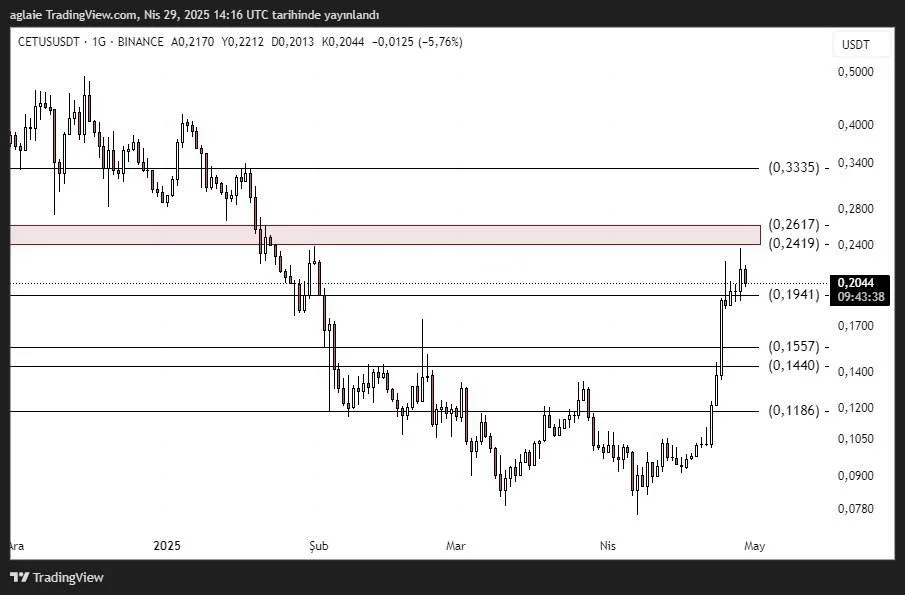
Currently, the price is trading around $0.2044, which represents an attempt to recover after a rejection from an important psychological and technical resistance zone.In other words, we are at a decision point.
Support Zones:
- $0.1941: Current support – price is trying to hold here after rejecting from resistance
- $0.1557 – $0.1440: Strong short-term support – if retested, buyers may step in
- $0.1186 – $0.1080: The bottom area where the last upward move started
Resistance Zones:
- $0.2419 – $0.2617: Critical resistance band that needs to be broken
- $0.3335: Broader time-frame target
CETUS has not only moved up rapidly but has also built a healthy upward structure.During the rally that started from the bottom levels, volume also increased notably — suggesting that the rise could be a structural transformation rather than just a short-term speculation.
The price structure is now creating higher lows and higher highs, indicating a classic bullish trend formation.However, the $0.2617 resistance is a key level where heavy selling occurred in the past, and it should be monitored carefully.Until this zone is broken, it would not be surprising to see the uptrend slow down or the price move sideways for a while.
Holding above $0.1941 is important for the continuation of the positive scenario.If the price rises again towards the $0.2419–$0.2617 band, how the price behaves in this region will determine the future of the trend.In the event of a breakout above the resistance, the next target to watch would be $0.3335.
In case of a pullback, closing below $0.1557 could signal a deeper correction.
Summary:
CETUS may have initiated a new trend with the strong price action it demonstrated over the past weeks.The bullish structure is technically supported, volume is positive, and a critical resistance is being tested.If a breakout occurs, much higher levels could come into focus for CETUS.
However, it is crucial for investors to act strategically and plan according to key levels.
These analyses do not constitute investment advice.They focus on support and resistance levels that are believed to offer short- and medium-term trading opportunitiesdepending on market conditions.All trading and risk management responsibilities lie solely with the user.Additionally, using stop-loss orders is strongly recommended for any trades mentioned.