
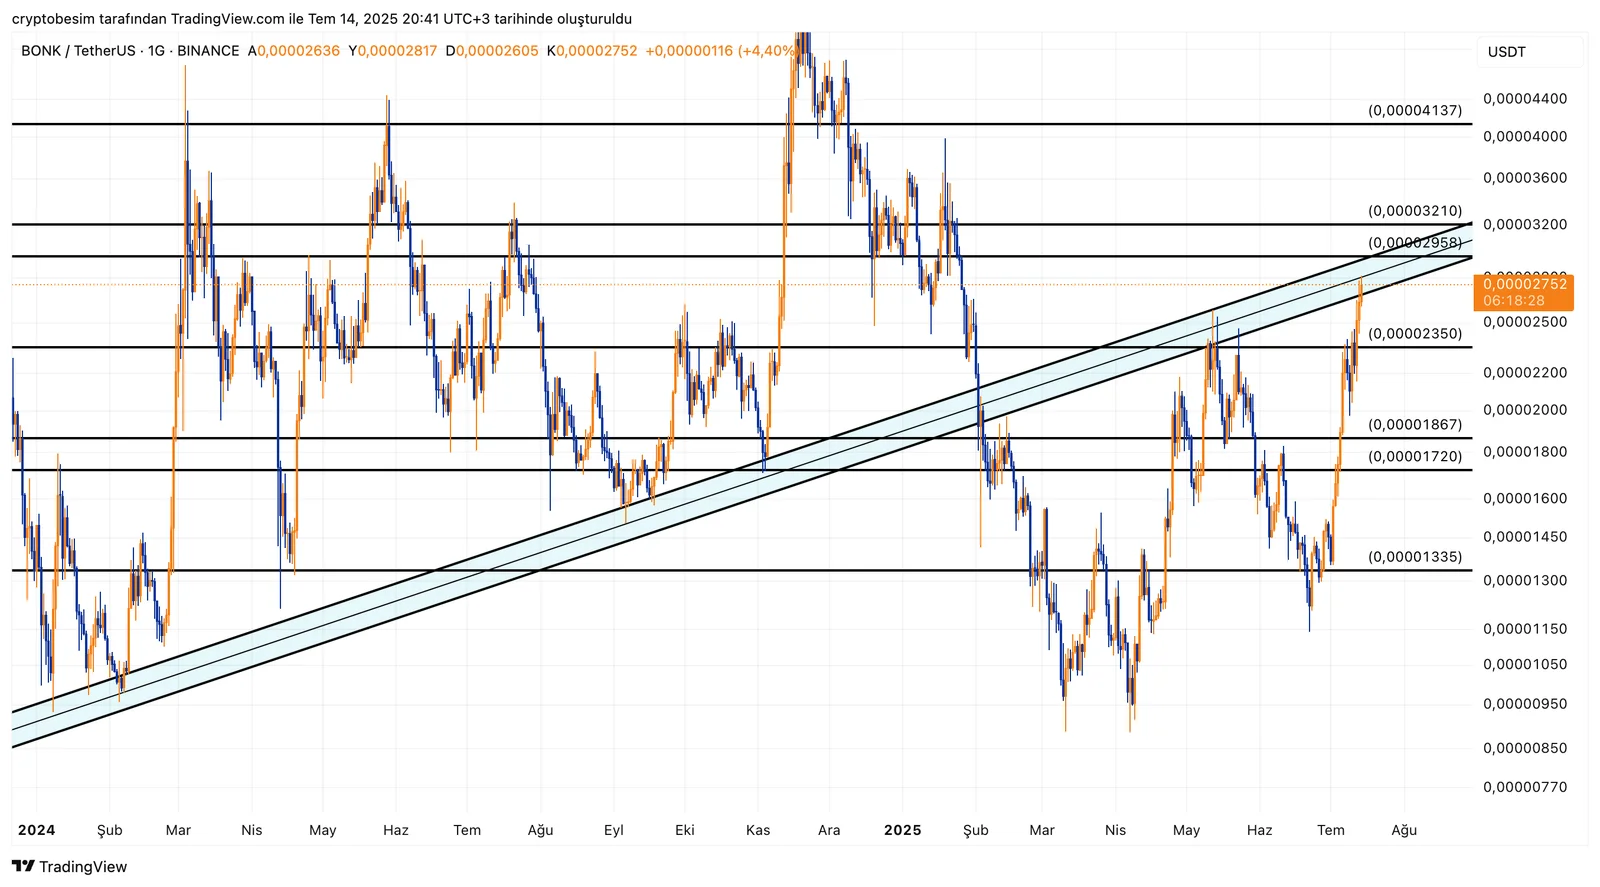
BONK Technical Outlook
Looking at the chart, we see that the price of the coin is currently testing the ascending trendline, which has worked as both support and resistance for the fourth time since 2024. This trendline has now merged with the horizontal resistance at approximately $0.00002958—in other words, the price is now under pressure from both the trendline and the horizontal resistance. If this zone breaks upwards, the level of $0.00003210 first and then the level of $0.00004137 could be targets.
On the other hand, the support level of $0.00002350 should be followed if the price gets rejected from this key level and pulls back. If the price can’t hold this level, then the levels of $0.00001867 and then $0.00001720 should be followed, and in case of deeper correction, the level of $0.00001335 will be the final support level. However, if the price can climb above the trendline and hold there, the upward movements can gain momentum. Otherwise, this zone could work as a strong resistance.
Summary:
- The support of the ascending trend now works as resistance.
- The fourth contact with this resistance has occurred on the chart on a daily timeframe.
- If this trendline, combining with horizontal resistance, breaks upwards, it can gain much momentum.
- If the price can hold above the level of $0.00002958, it can then target the levels of $0.00003210 and $0.00004137.
- In case of possible pullbacks, the support levels of $0.00002350 → $0.00001867 → $0.00001720 → $0.00001335 should be closely followed.
These analyses, not offering any kind of investment advice, focus on support and resistance levels considered to offer trading opportunities in the short and medium term according to the market conditions. However, the user is responsible for their own actions and risk management. Moreover, it is highly recommended to use stop loss (SL) during the trades.


