
BTC Technical Analysis
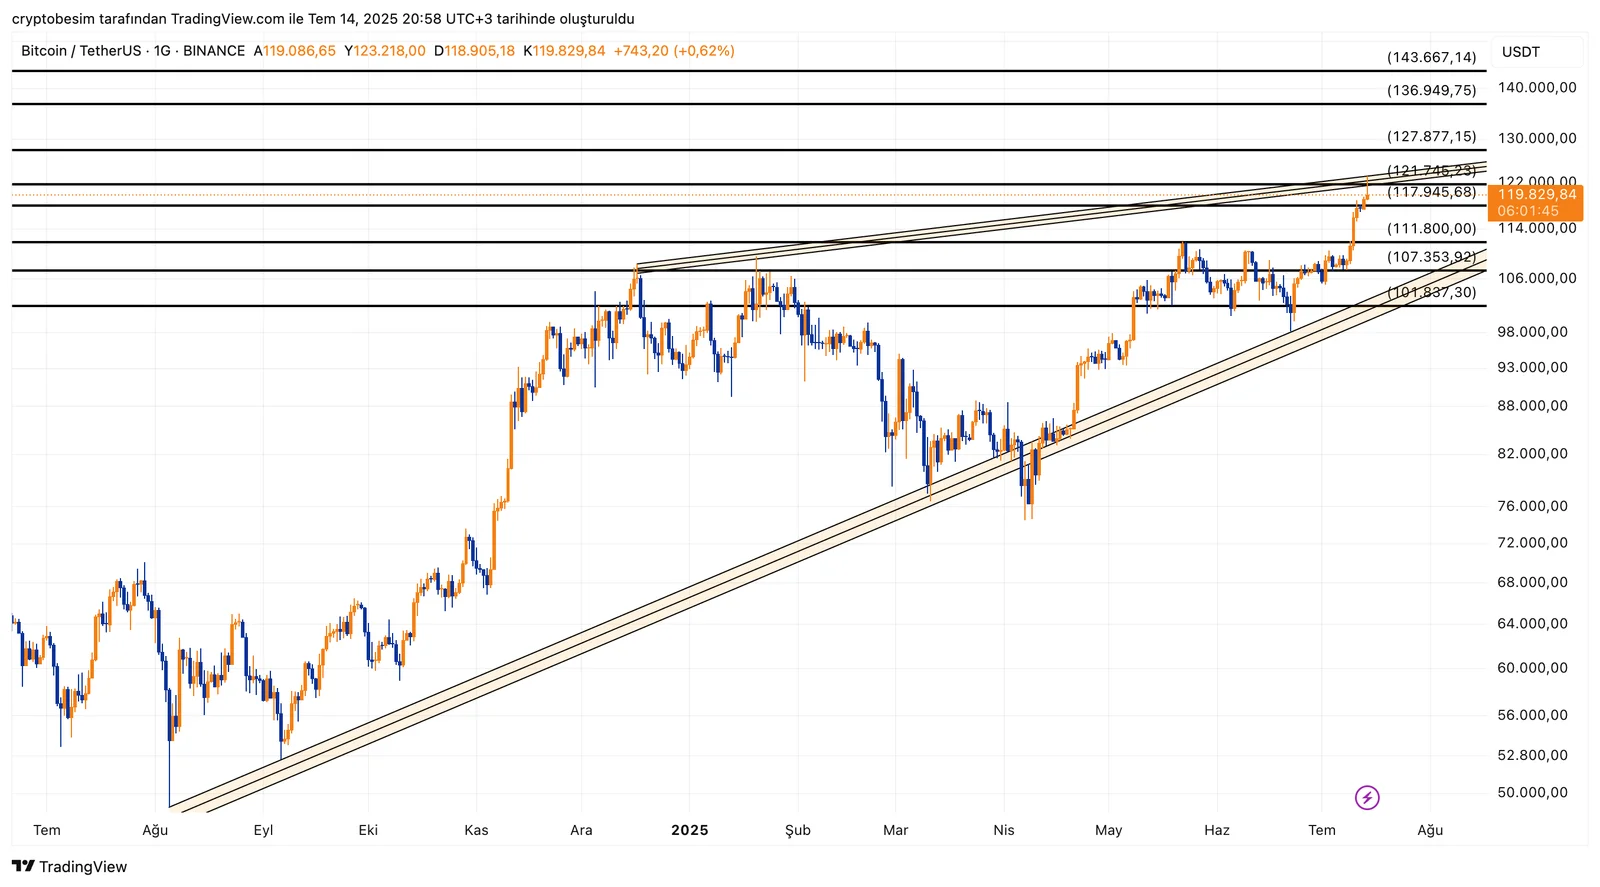
The BTC chart displays two ascending trends, one of which appears in the lower zone since August 2024. The other one, located in the upper zone of the price, is the resistance trend coming from December 2024. The price of the coin is constantly improving its momentum with a new ATH level each time and testing the resistance around $117,000 - $121,000. This resistance level also intersects with the trend mentioned earlier.
In times of such high volatility and strong momentum, trends like this can demonstrate divergence in the targets, both during bull and bear periods—and this is what we see today. The target of the pattern can be determined by the direction of the breakout. Looking at the Fibonacci levels, it can be said that the levels of $143,000 - $146,000 could be the next targets.
Keep in mind that price pullbacks after such great price jumps should be considered healthy and important for creating opportunities. The levels you see on the chart are major support and resistance levels.
🔼 Resistance Levels
- $121,745 → First strong resistance
- $127,877 → Middle-term target
- $136,949 → Upper zone resistance
- $143,667 → Main target
🔽 Support Levels
- $117,945 → First support (key level)
- $111,800 → Middle-term support
- $107,353 → Deeper correction support
These analyses, not offering any kind of investment advice, focus on support and resistance levels considered to offer trading opportunities in the short and medium term according to the market conditions. However, the user is responsible for their own actions and risk management. Moreover, it is highly recommended to use stop loss (SL) during the trades.


