
BNB Technical Outlook
Analyzing the BNB chart, we see that the long-standing ascending channel has broken above, and the price confirmed this breakout with great volume. The uptrend looks positive, and the price is moving towards new targets swiftly.BNB is currently trading around $1057; holding above the level $1008 suggests that the breakout is valid and the uptrend is still intact.
BNB has the potential to surge to the level at $1107 in the short term. Breaking above this level, the price could go up to test other targets at $1233 and $1393. When we calculate the target in terms of the channel’s length, the ultimate technical target zone appears to be $1500–$1530 in the mid term.
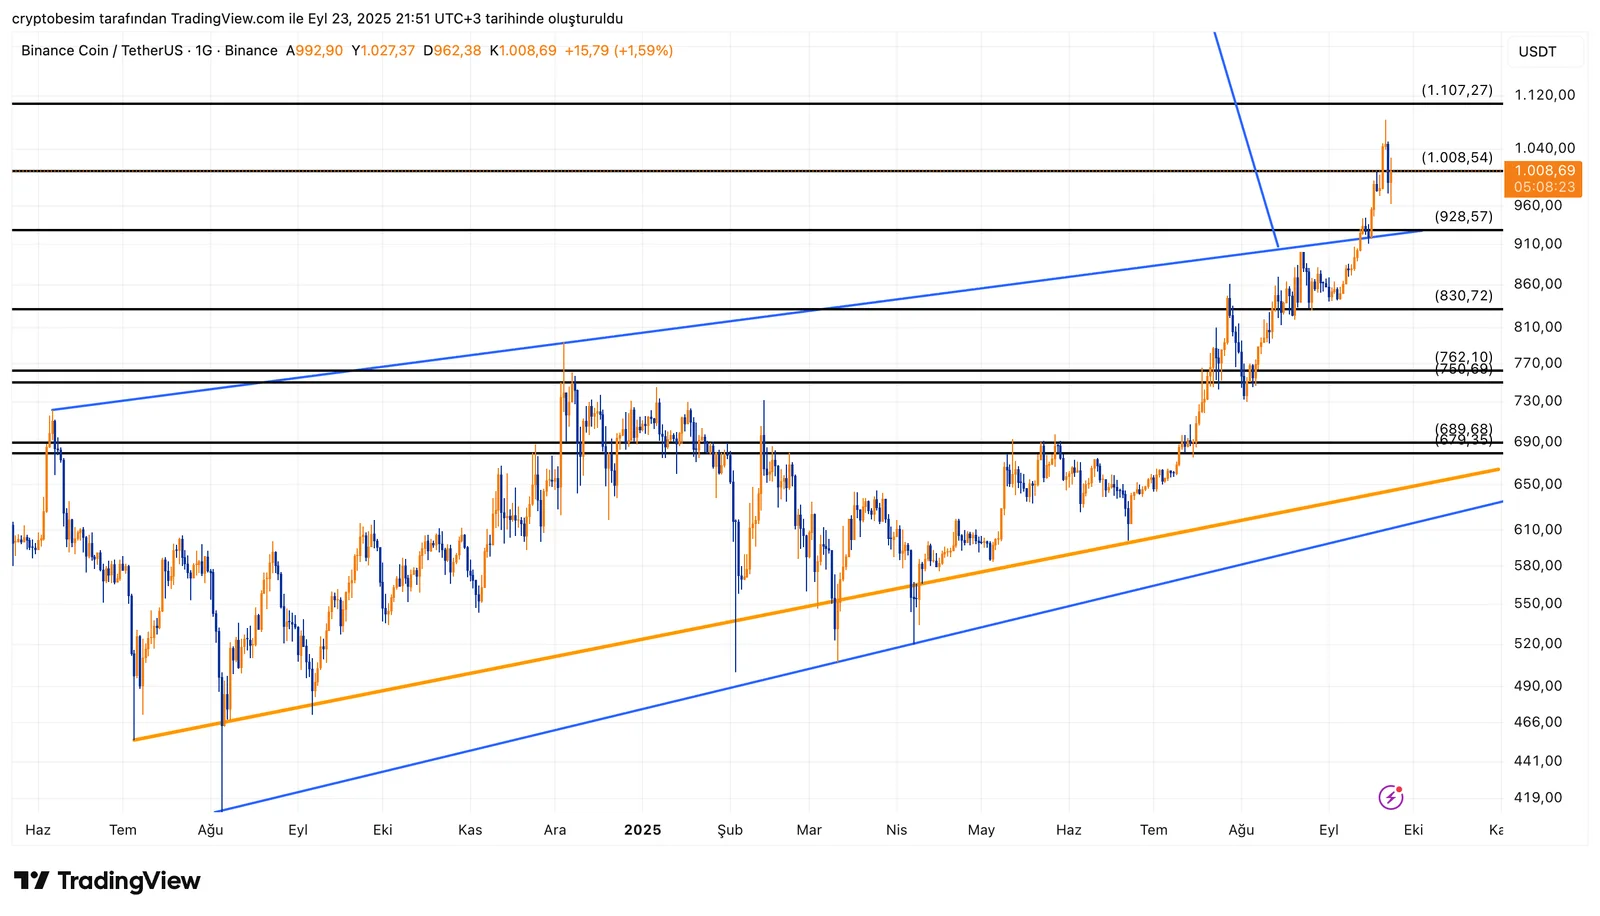
We should be watching the following support levels in case of a pullback:
- $1008 (key support, holding above it is positive)
- $928 (key horizontal support)
In short, BNB is printing a very strong bullish momentum and is highly likely to test new ATH levels.
These analyses, not offering any kind of investment advice, focus on support and resistance levels considered to offer trading opportunities in the short and medium term according to the market conditions. However, traders are responsible for their own actions and risk management. Moreover, it is highly recommended to use stop loss (SL) during trades.


