
Bitcoin Cash (BCH): Breaking Out of Years of Pressure and a Momentum Reversal
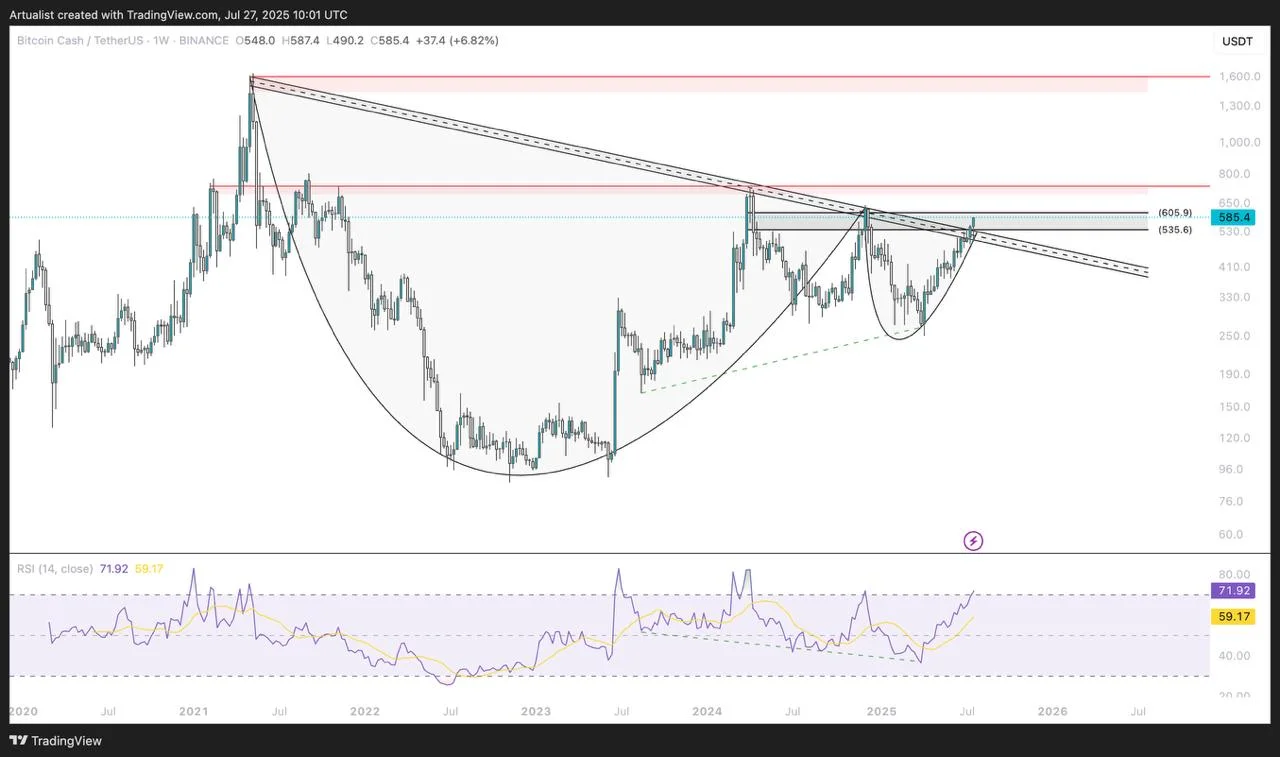
When we analyze BCH on a weekly time frame, we see that BCH is printing a huge comeback story. The descending trend line suppressing the price as of 2021 is now at a breaking point. The first candlestick above the trendline is just hours away from closing this week, and this breakout represents the breakout of a falling structure persisting for almost four years.
The price has tested the neckline of the formation at the level of $585.4. This area is the intersection of both the downtrend and the horizontal resistance that hasn't been broken for over a year. However, this contact is no coincidence. Before reaching this level, a massive cup-and-handle pattern formed on the weekly chart. It can be stated that this formation alone carries the potential for a major breakout.
Looking at the levels, as soon as the breakout is complete, the first short-term targets will be the levels at $605.9, followed by $640.
A short-term retest of the trend structure, which has broken out of this zone, is possible. Momentum could increase as buyers prevail over sellers in this zone.
Positive Divergence: A Silent Reversal
Bitcoin Cash's RSI failed to confirm the new lows it made throughout 2022 and 2023. While the price made new lows, the RSI made higher lows. This is a classic and powerful example of positive divergence.
In other words, the market was falling on the surface, but buying power was beginning to strengthen internally. Such divergences indicate a reversal, not an end to a trend. In the case of BCH, this signal has been building for months, and now, along with the price, the RSI is breaking upwards.
Positive divergences often precede large price movements. However, most investors only notice this signal in retrospect. In the case of BCH, this signal occurred on a weekly basis, meaning its impact wasn't short-term but could sustain a months-long upward trend.
Target of the Formation: Between the levels $1,300 – $1,600
The cup-and-handle pattern on the chart is not ordinary. It formed over a long period, encompassing a period of high volume and years of bottoming. A break above the neckline technically brings not only the $650–$700 target but also the broader $1,300–$1,600 range within reach.
In short, Bitcoin Cash's current situation cannot simply be described as "rising." It's the end of a years-long pressure. The price reaching the neckline is no coincidence; it's the result of a deliberate formation. Having remained silent for three years, BCH will soon be on everyone's radar. Those who are now taking their place are the ones who read the structure before the breakout. For the rest, this chart will soon be known only as "if only."


