
AVAX Technical Analysis
When analyzing AVAX chart on a daily time frame, we see that there is a clear ascending wedge/channel pattern. The price of the coin tested the upper border of the channel following the recent rise and then saw a slight pullback. AVAX is currently trading around the level $28.69, standing in a short-term decision area.
There is a potential for a move equal to the height of the channel provided that the channel breaks upward. If this scenario works, the price will target the level at $31.23, followed by $36.64. It is important that this price breakout should be supported by some volume.
According to a bearish scenario, the price may go down to the level at $29.14 first and then to the lower border of the channel if the price fails to hold above $29.14. If we see a breakdown of the channel, the price is likely to test the range between the levels $24.66 and $23.95.
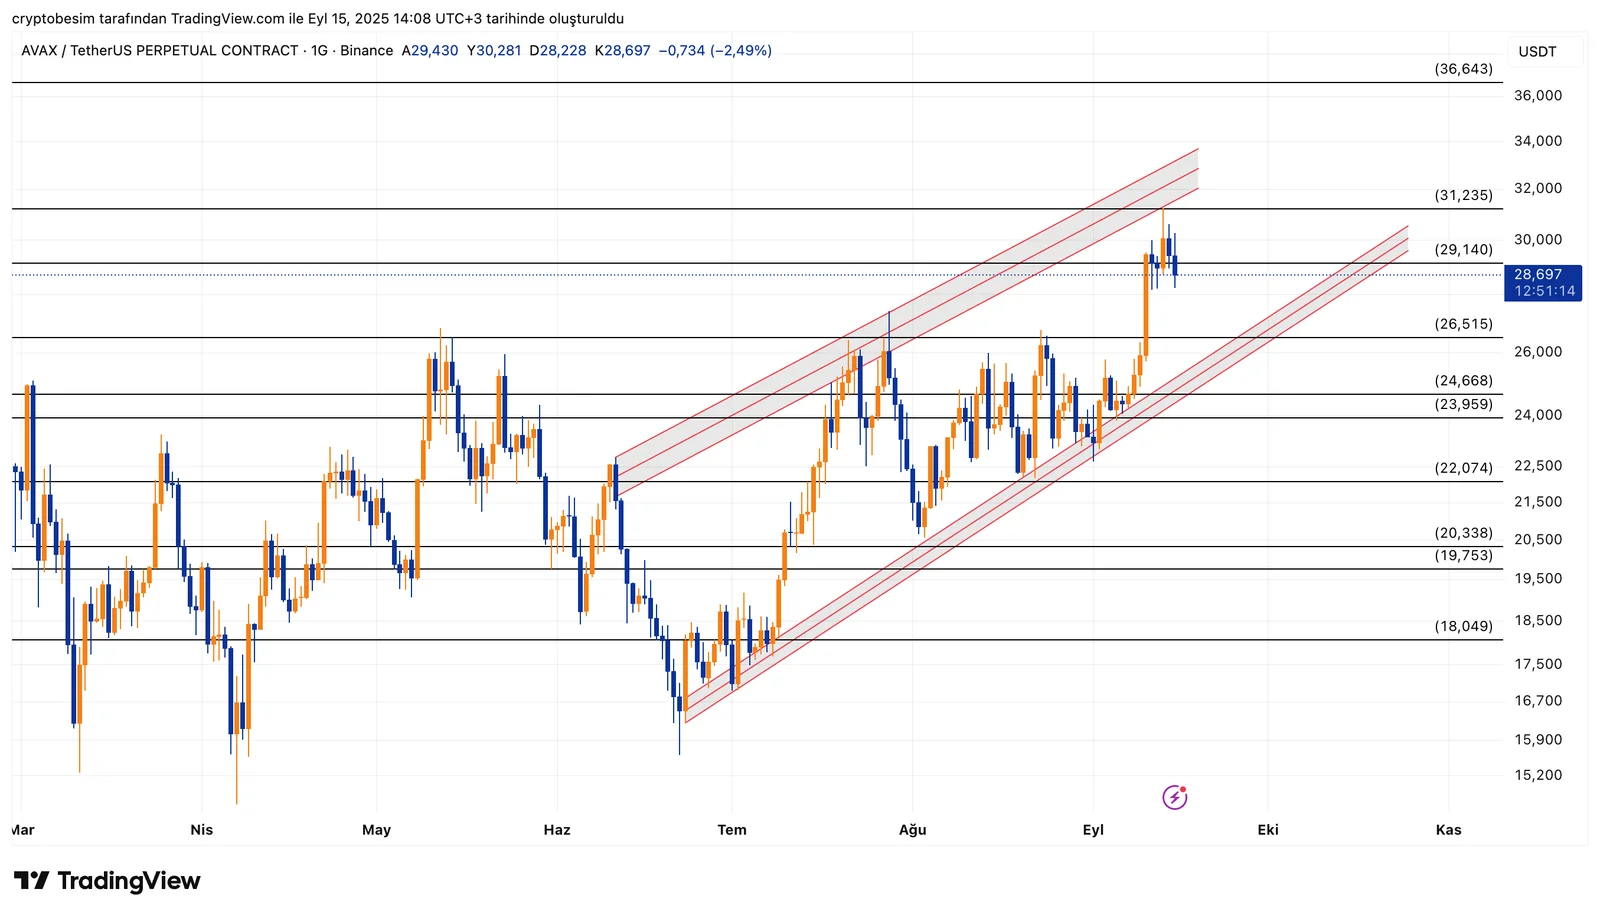
Summary:
- Current price: $28.69
- Upside: Targets at $31.23 and $36.64 if breakout holds
- Downside: Below $29.14, watch $26.51 and then $24.66
- Whichever side breaks, expect a move equal to the channel’s height
These analyses, not offering any kind of investment advice, focus on support and resistance levels considered to offer trading opportunities in the short and medium term according to the market conditions. However, traders are responsible for their own actions and risk management. Moreover, it is highly recommended to use stop loss (SL) during trades.


