
AVAX Technical Outlook
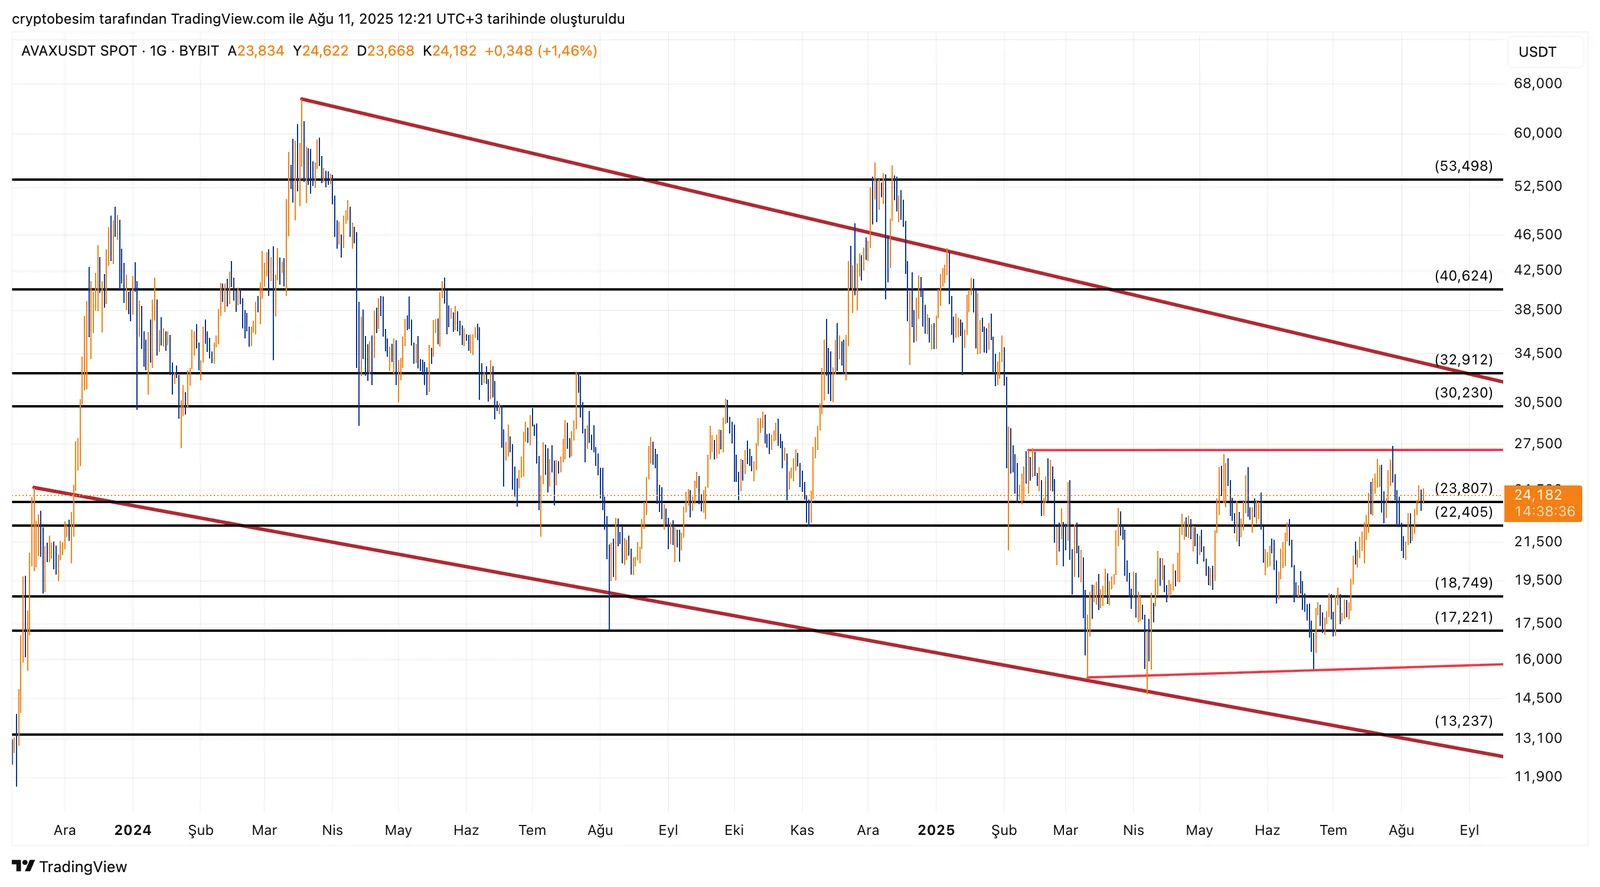
AVAX has been moving within a broad descending channel for an extended period, with the lower, middle, and upper bands of the channel still maintaining their technical validity.
Currently, the price is trading just above the horizontal resistance at $23.80. The $22.40 - $23.80 range is a critical zone, acting both as a horizontal support-resistance flip area and a key region based on previous swing highs and lows. Sustained price action above this zone would keep the upside potential intact, increasing the likelihood of a move toward the upper band of the channel.
The upper band of the channel overlaps with the $30.20 – $32.91 resistance zone. This zone will serve as a strong barrier in any potential upward wave. A decisive breakout of this level, supported by strong volume, would also mark an upward break of the descending channel structure, opening the door for a medium-term bullish trend.
On the downside, a drop below $22.40 would bring the $20.00 level into focus as the first support. Below that, $18.74 should be monitored as a critical defense line. Closing below these levels could increase the risk of a deeper pullback toward the channel’s lower band.
Summary:
- Price: $24.18, trading near the middle-upper band of the descending channel
- Support zone: $22.40 – $23.80 (holding above is bullish)
- Resistance: $30.20 – $32.91 (overlaps with the channel’s upper band)
- Lower supports: $20.00 → $18.74
- Overall structure: Still within the descending channel but approaching a key resistance area. Sustaining above $23.80 strengthens the bullish case, while a break above $30 could signal a trend reversal.
This analysis does not constitute investment advice. It focuses on support and resistance levels that may offer potential short- and medium-term trading opportunities depending on market conditions. Trade execution and risk management remain entirely the responsibility of the user, and the use of stop-loss orders is strongly recommended.


