
ARB Technical Analysis
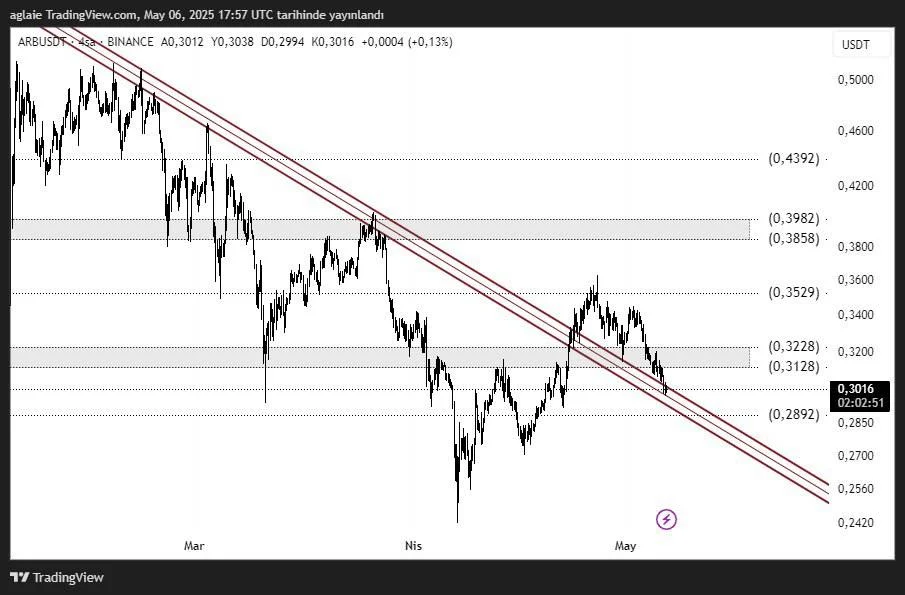
ARB has finally broken out of its long-standing downtrend, marking a significant technical milestone. Following this breakout, the price climbed to $0.3529, but failed to sustain that level and pulled back toward the $0.30 zone — a key test area for market participants.
The current level at $0.3016 serves as both a psychological and technical support. Holding this area could open the door for a renewed bullish wave. However, if it fails, the breakout may be seen as a false move, increasing selling pressure once again.
Support Levels:
- $0.3012–$0.2892: Current support zone and post-breakout retest area
- $0.2560: Main support if downside continues
- $0.2430: Liquidity zone and major long-term support
Resistance Levels:
- $0.3128–$0.3228: First major resistance and decision area
- $0.3529: Previous high and short-term market structure break (MSB)
- $0.3858–$0.3982: Mid-term resistance target zone
The chart shows that while the downtrend has been broken, buyers haven’t yet shown strong follow-through volume. RSI indicates a recovery from oversold territory, but momentum needs confirmation. If ARB holds above support and breaks $0.3228, it could build a more bullish structure. Otherwise, the price may fall back into the previous channel.
Conclusion: ARB has delivered a positive technical signal by breaking its descending trendline. However, sustaining this breakout depends heavily on maintaining support above $0.30. If it holds, short-term targets include $0.35, followed by $0.40. If support fails, stop-loss strategies may become essential for risk management.
Disclaimer: This analysis does not constitute investment advice. It focuses on support and resistance levels that may present potential short- to mid-term trading opportunities depending on market conditions. However, all responsibility for trading decisions and risk management lies entirely with the user. The use of stop-loss orders is strongly recommended for any trade setup shared.


