
ARB/USDT Technical Analysis
Analyzing the ARB chart on a weekly timeframe, we observe that the descending channel structure remains intact. The price recently moved up to test the upper border of the channel but failed to hold, resulting in renewed downward pressure. As long as no breakout occurs, the price is likely to continue trading within the boundaries of the channel.
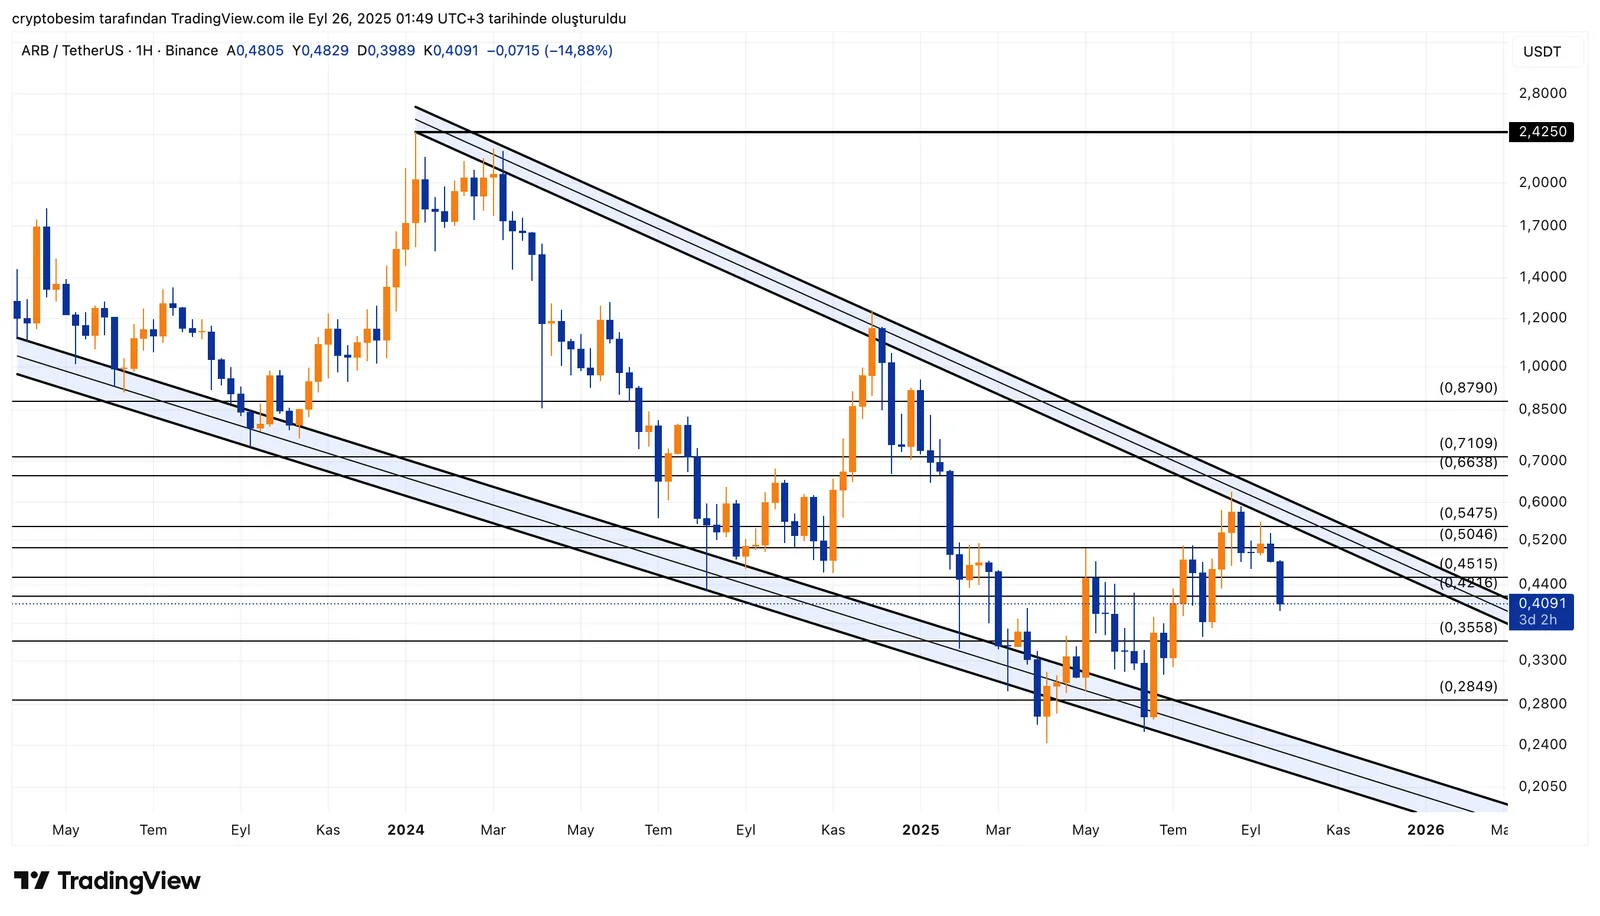
ARB is currently trading around $0.4091. It recently surged to $0.4515 but was unable to sustain the move and reversed downward. This level now stands as the most critical short-term resistance. If the price can close above $0.4515, ARB may target the next resistance levels at $0.5046 and $0.5475. A confirmed breakout would require a strong move above the range of $0.66–$0.71. Once this range is surpassed, we can begin to talk about the mid-to-long-term technical target of the channel formation: $2.42.
In a bearish scenario, $0.3558 is the first key support to watch. A breakdown below this level could lead to a retest of $0.33, and possibly the lower border of the channel around $0.28.
Summary:
- ARB continues to trade within a descending channel.
- A daily close above $0.4515 is critical for short-term trend reversal.
- Resistance levels: $0.5046 → $0.5475 → $0.66–$0.71
- Support levels: $0.3558 → $0.33 → $0.28
- Mid-to-long-term technical target: $2.42 (if the channel breaks upward)
These analyses, not offering any kind of investment advice, focus on support and resistance levels considered to offer trading opportunities in the short and medium term according to the market conditions. However, the user is responsible for their own actions and risk management. Moreover, it is highly recommended to use stop loss (SL) during the transactions.


