
AltLayer (ALT) Technical Analysis
AltLayer (ALT) continues to move within a descending channel pattern, with the price currently trading near the lower boundary at $0.02608. Following a period of low-volume selling pressure, ALT has once again slipped toward the channel base — marking a technically crucial level.
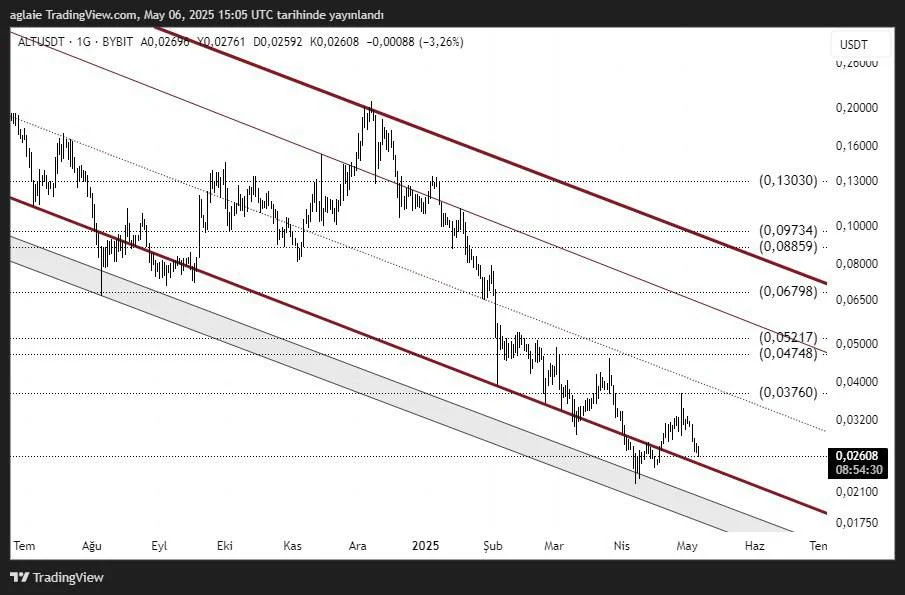
However, if the channel support fails and the price closes below $0.02100, the market may enter a deeper correction phase with possible new lows.
Key Technical Levels
Support Zones:
- $0.02600–$0.02100: Major support zone near the channel bottom
- $0.01750: Final support line within the descending channel
Resistance Zones:
- $0.03760: Short-term resistance and liquidity zone
- $0.04748–$0.05217: Mid-term resistance band
- $0.06798: Short-term market structure break (MSB) level
- $0.08859–$0.09734: Resistance-turn-support (SR Flip) region
- $0.13030: Potential reaction zone after a confirmed breakout
Price action over the coming days will likely be defined by how ALT reacts within the $0.02600–$0.02100 support zone. A strong bounce with volume could revive bullish momentum, while a failure to hold this range might lead to a breakdown below the channel.
Conclusion: AltLayer is currently positioned at a technically sensitive area. Proximity to the channel’s lower boundary presents a potential reversal opportunity, but also carries the risk of deeper downside if support fails. The $0.02100 level acts as a last-resort threshold. On the upside, if the price bounces, the first target is $0.03760, followed by $0.04748–$0.05200 as a mid-term objective. For buyers, this zone offers a compelling risk-reward setup.
Disclaimer: This analysis does not constitute investment advice. It focuses on support and resistance levels that may present potential short- to mid-term trading opportunities depending on market conditions. However, all responsibility for trading decisions and risk management lies entirely with the user. The use of stop-loss orders is strongly recommended for any trade setup shared.


