
Price movements in the crypto market can quickly change investors’ expectations and decisions. The fear and greed index tracks these shifts through a numerical indicator; this guide explores its calculation, sentiment levels, and role in crypto analysis.
What Does the Fear and Greed Index Tell You?
The fear and greed index evaluates market sentiment using selected data. It summarizes factors such as price behavior, trading activity, and investor interest on a shared scale. Market sentiment refers to investors’ general expectations and willingness to take risks. Growing optimism can strengthen buying interest, while increasing uncertainty may encourage investors to reduce their exposure.
However, the index does not function as a comprehensive survey that directly measures everyone’s emotions. It assesses the market’s psychological state using data selected by its provider.
What Does a Score Between 0 and 100 Mean?
Low index values indicate fear, while high values indicate greed. Zero represents extreme fear, and 100 represents extreme greed. You should not interpret the score as a probability or a percentage of investors. For example, a score of 80 does not mean that 80% of investors are buying. Similarly, a score of 20 does not indicate that prices will fall by 20%. The scale makes it easier to compare sentiment across different periods.
How Do FOMO and FUD Affect Investor Behavior?
FOMO stands for fear of missing out. During rapid price increases, investors may feel pressure to buy before completing their research. Social media posts showing investment gains can intensify this pressure. Following other people’s trades may cause investors to overlook their own investment horizon and loss tolerance. FUD stands for fear, uncertainty, and doubt. In crypto markets, the term often describes news or narratives that cause concern.
However, assuming that every negative report is unfounded would be a mistake. Security vulnerabilities, payment problems, and operating restrictions can create real risks. When conducting sentiment analysis, you should examine the source and accuracy of the news separately. The index does not verify whether a particular claim is true.
How Is the Index Calculated, and What Data Does It Use?
There is no single universal crypto fear and greed index. Different providers use different datasets and calculation methods. For this reason, check the source before interpreting a score. Seeing different readings on two platforms on the same day does not necessarily indicate a data error.
Components of the Alternative.me Index
Alternative.me’s published methodology focuses on Bitcoin. Its page lists the following components and weights:
| Component | Published weight | Data examined |
Volatility | 25% | Bitcoin volatility and drawdowns from peak prices, compared with 30-day and 90-day averages |
Market momentum and volume | 25% | Momentum and trading volume relative to 30-day and 90-day averages |
Social media | 15% | Posts involving Bitcoin-related hashtags and the speed of engagement |
Surveys | 15% | Investor opinions; the provider has paused this component |
Bitcoin dominance | 10% | Bitcoin’s share of the total cryptocurrency market capitalization |
Google Trends | 10% | Bitcoin-related searches and changes in search interest |
Because surveys are paused, you should not read this table as a current formula with all six components active. The provider does not explicitly explain on the page how it redistributes the unused weight. We therefore cannot recalculate the remaining percentages and present them as definitive current weights. Alternative.me updates its index daily; its Bitcoin-focused methodology does not measure each altcoin’s conditions separately.
What Distinctions Matter When Reading These Components?
Volatility describes the magnitude of price movements. When a volatility indicator rises, you still need to examine the direction and cause of those movements. Trading volume alone does not explain buying interest either. Volume can increase during heavy selling, so price direction and execution conditions matter.
Bitcoin dominance shows the relationship between market capitalizations. An increase does not always mean investors are selling altcoins to buy Bitcoin. For example, Bitcoin and altcoins can decline simultaneously. If altcoins’ combined value falls faster, Bitcoin’s market share can still rise. Social media activity and search interest also need context. News of a hack can increase searches for a project; greater attention does not always indicate optimism.
Why Do Different Providers Produce Different Results?
CoinMarketCap’s index uses a different combination of data from Alternative.me. Its methodology includes price momentum among major crypto assets, expected Bitcoin and Ethereum volatility, options data, market composition, and the platform’s own interest metrics.
Combining two providers’ scores as though they belonged to the same continuous series would therefore be misleading. Using the same source for historical comparisons supports a more consistent assessment.
Algorithmic calculation alone does not guarantee neutrality or accuracy. Data selection and weighting directly affect the result.
From Fear to Greed: How to Interpret the Index
Looking only at today’s score can cause you to miss the direction of change. The same reading can carry a different meaning depending on previous days. For example, an increase from 15 to 35 may suggest that fear is easing. A decline from 60 to 35 may indicate deteriorating sentiment.
The Five Main Sentiment Levels
Category thresholds can differ between providers, so check the classification displayed alongside the score. You can interpret the main categories as follows:
| Level | General interpretation | What it does not establish on its own |
Extreme fear | Concern and risk aversion are pronounced | That prices have bottomed |
Fear | Cautious expectations are becoming more prominent | That the decline will definitely continue |
Neutral | Neither fear nor greed clearly dominates | That the market is risk-free |
Greed | Optimism and willingness to take risks are strengthening | That further gains are guaranteed |
Extreme greed | Intense optimism and pressure to avoid missing out may emerge | That prices will fall immediately |
These categories do not produce price targets. They also do not directly establish an asset’s economic value or a project’s quality.
Does Extreme Fear Mean a Buying Opportunity?
Some investors use widespread fear as a starting point for researching potential opportunities. This approach rests on the idea that the crowd’s expectations can become excessive. However, trading without understanding the cause of fear carries risks. Temporary panic and a serious fundamental problem can both coincide with similarly low readings.
For example, broad market selling and a security vulnerability in a specific project are different situations. In the latter case, a low price does not provide evidence that the project will recover. When you see a low score, examine prices, news, and liquidity together. Do not conclude that prices “cannot fall any further” based solely on the index.
Does Extreme Greed Indicate When to Sell?
High scores can accompany periods when investors start underestimating risks. Borrowing and leverage can magnify the effects of price fluctuations, particularly during rapid rallies. Nevertheless, elevated sentiment can persist throughout a strong trend. The first extreme greed reading does not necessarily mark the market’s peak.
You can use the index as a prompt to reassess your existing exposure. Checking whether position sizes and potential losses fit your plan offers a more practical approach than predicting direction from a single score.
How Can You Include the Index in Crypto Analysis?
The fear and greed index is one of several market indicators that add context to research. Its usefulness does not require it to replace other information. When you encounter a cryptocurrency index, identify what it measures. A sentiment index and an index tracking the price performance of selected assets answer different questions.
Read It Alongside Prices, Volume, and Fundamentals
You can compare the index score with the following information:
- Price trend: Whether the market is forming higher or lower lows.
- Trading volume: How much trading activity accompanies the price movement.
- Liquidity: The potential impact of large orders on prices.
- Technical analysis tools: Moving averages, RSI, and support and resistance areas.
- Fundamental developments: Network usage, security issues, and token unlocks.
- Macroeconomic conditions: Interest rate expectations and broader risk appetite.
However, seeing the same data reflected in different indicators does not count as independent confirmation. Price and momentum data may already form part of the index. For example, rising prices, stronger momentum, and a higher sentiment score may reflect the same movement. Treating them as three separate pieces of evidence can create excessive confidence.
Working Through a Hypothetical Example
Suppose a sentiment index falls from 70 to 22 within a week. During the same period, Bitcoin’s price declines and trading volume rises. This suggests that the market has become more cautious in a short time. It does not establish that selling has ended or that a rally will begin the following day.
To develop the analysis, consider these questions:
- Is there a verified development behind the selling?
- Is the movement limited to Bitcoin or visible across the wider market?
- Could reduced liquidity have amplified the price movement?
- Is the high volume concentrated on a few platforms?
- If you trade, what conditions would cause you to revise your assessment?
The purpose of this example is to investigate the reasons behind the change in market sentiment. A score of 22 should not automatically become a buy signal.
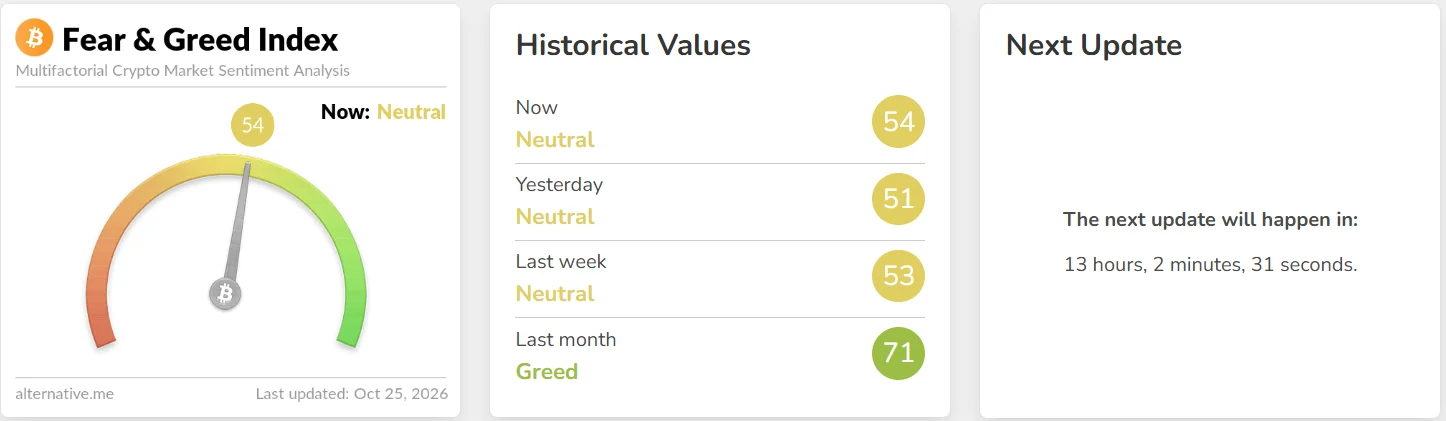
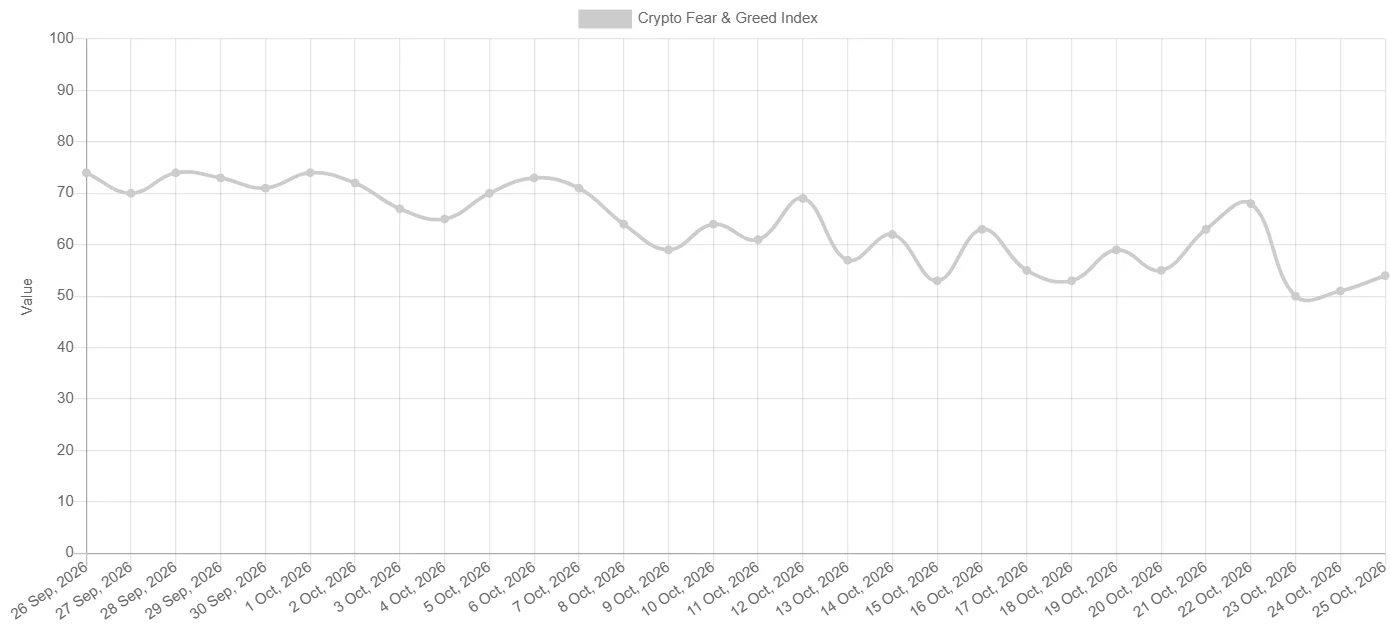
For example, Alternative.me’s reading dated October 25, 2026, places the index in “neutral” territory at 54, compared with 51 the previous day, 53 a week earlier, and 71 a month earlier. The daily and weekly comparisons suggest limited change, while the shift from last month’s “greed” reading to neutral indicates weaker optimism; however, this alone does not establish whether prices will rise or fall.
Track Market Cycles and Your Own Decisions
Crypto market dynamics include changes in optimism and concern over time. The index’s history can help you examine how these shifts align with price movements. Still, cycles do not repeat in the same sequence or over identical periods. A score that coincided with a recovery in the past may not produce the same outcome later.
Recording your own decisions can also help. Note the score on the day of a trade, your reasoning, and the conditions you expected, then compare them later. This record can reveal how investor psychology affects your decisions. You can examine whether you rush into rising markets or abandon your plan during declines.
The Index’s Limitations and Common Mistakes
The index is limited by the scope of its underlying data. You should not expect it to represent every investor, platform, or token. Social media data, in particular, can reflect the characteristics of its user base and the quality of its content. The SEC and FINRA highlight risks such as misleading information and missing context in social sentiment tools.
Common interpretation mistakes include:
- Automatically treating a low score as “cheap” and a high score as “expensive.”
- Applying a Bitcoin-focused reading to every altcoin.
- Assuming different providers calculate their scores using the same methodology.
- Using daily data as a real-time trading signal.
- Assuming an approach that worked in the past will work again.
- Relying on the index while overlooking position size or leverage risk.
Market prices can change throughout the day while the displayed index score remains unchanged. Check the data’s date and update frequency. Likewise, the difference between a score of 24 and 25 does not, by itself, indicate a fundamental shift. Context and the direction over a broader period matter more than small daily movements.
Frequently Asked Questions
Below are some frequently asked questions and answers about the fear and greed index:
- How often is the fear and greed index updated?: Update frequency depends on the provider. Alternative.me publishes daily data; check the timestamp on the platform you use.
- Does the crypto fear and greed index apply only to Bitcoin?: The scope differs between indices. Alternative.me’s methodology focuses on Bitcoin, while CoinMarketCap uses a broader combination of data.
- Why does the index use a scale from 0 to 100?: A shared scale makes sentiment easier to compare across periods. The score does not represent a percentage of investors or the probability of a price movement.
- What should I do during extreme fear?: First, assess the developments causing fear and your existing exposure. A low score does not mean you need to trade or that prices have bottomed.
- Does the index always provide accurate signals?: No; the index does not identify exact buying or selling times. Prices can continue moving in the same direction while fear or greed persists.
- How does the index relate to market cycles?: The index can help track changes in risk appetite across periods. However, it cannot independently determine when a cycle begins, how long it lasts, or when it ends.
Explore JrKripto’s candlestick chart guide to assess market sentiment alongside price movements. Discover how supply dynamics fit into your analysis with the Bitcoin halving and tokenomics guides.

