
When you open a Bitcoin or another cryptocurrency chart, you see colorful candles of different sizes. These shapes show where the price started, which levels it reached, and where it closed during a particular period. Understanding crypto candlestick charts helps you assess price movements more clearly. However, reading charts does not mean predicting the future with certainty; you need to examine candles alongside trading volume, market conditions, and the timeframe.
What Are Crypto Candlestick Charts, and What Do They Show?
A candlestick chart displays an asset’s price movements over specific time intervals. Each candle combines four key prices for the selected period: open, high, low, and close.
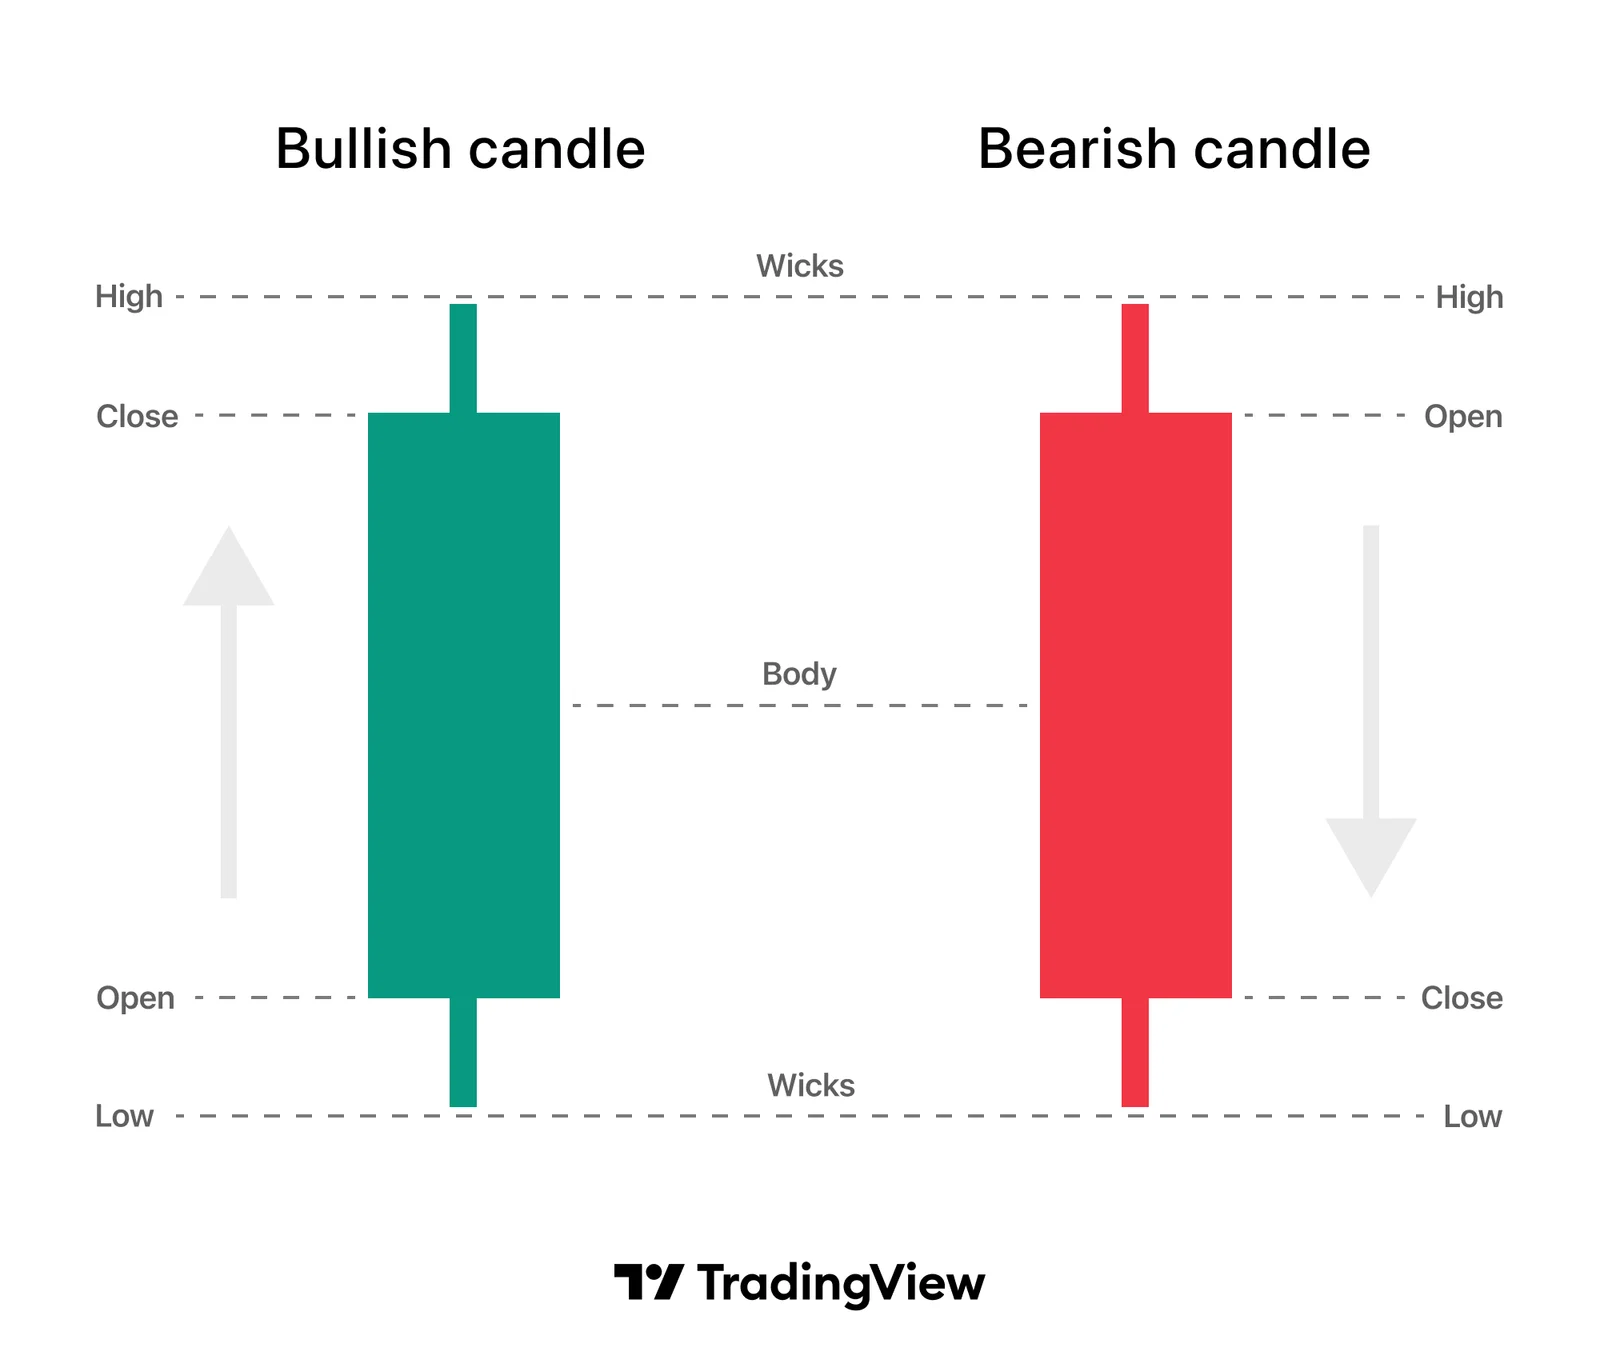
The abbreviation OHLC, which frequently appears on chart screens, comes from the initials of these four terms.
For example, each candle on a one-hour Bitcoin chart represents one hour of price movement. On a daily chart, a single candle summarizes an entire day’s data. This structure shows more than whether the price rose or fell. It also reveals the fluctuations within the period and where the closing price sits within that range.
The candle body and wicks
The thick section of a candle is called the “body.” It shows the distance between the opening and closing prices.
The thin lines extending above and below the body are called “wicks” or “shadows.” The upper wick reaches the period’s highest price, while the lower wick reaches its lowest.
| Candle component | Information it shows |
Open | The price at the beginning of the selected period |
Close | The final price of the completed period |
High | The highest price reached during the period |
Low | The lowest price reached during the period |
Body | The distance between the opening and closing prices |
Wicks | Price movements beyond the body |
A candle may have no upper or lower wick. For example, a bullish candle has no upper wick if its closing price equals the period’s high.
A long body shows a large difference between the opening and closing prices. A long wick shows that the price moved away from the body but retreated from that level before the close.
What do green and red candles mean?
On standard candlestick charts, green usually means the closing price was higher than the opening price. Red means the closing price was lower.
However, colors can vary according to platform settings. When using a chart for the first time, check what its colors represent.
A green candle does not mean the price rose continuously throughout the period. The price may fall first, then recover and close above the open.
Similarly, a strong upward movement can occur within a red candle. If the closing price remains below the open, the candle still appears red.
The candle’s color and the daily percentage change on the screen can also tell different stories. One uses the selected candle’s opening price, while the other may use a different comparison period.
How to Read Crypto Candlestick Charts
Learning how to read crypto candlestick charts starts with choosing the right data. The trading pair, timeframe, and whether the candle has closed all affect your interpretation.
Before focusing on a particular shape, understand which market the chart represents. Then compare the candle’s details with the surrounding price movements.
Choosing the trading pair and timeframe
A BTC/USDT chart shows Bitcoin’s price in USDT. A BTC/EUR chart shows its price in euros.
Seeing the same asset on two charts is therefore not enough for a direct comparison. Also check which currency expresses the price.
Because crypto markets trade continuously, a daily candle’s close does not mean the market has closed. It simply marks the end of the selected daily measurement period.
Common timeframes include:
| Timeframe | Period covered by each candle | Main focus |
5 minutes | Five minutes of price movement | Very short-term fluctuations |
15 minutes | Fifteen minutes of price movement | Smaller intraday movements |
1 hour | One hour of price movement | Intraday price structure |
4 hours | Four hours of price movement | A broader short-term view |
1 day | One day of price movement | Trends across days and weeks |
1 week | One week of price movement | Longer-term price structure |
The same asset can look different across timeframes. A daily chart may show an ongoing decline while an hourly chart shows a recovery.
For example, a few hours of rising prices do not prove that a weeks-long decline has ended. It helps to assess short-term movements within a broader timeframe.
A numerical example of reading a candle
Suppose a hypothetical cryptocurrency records these prices over one hour:
- Open: $100.
- High: $108.
- Low: $97.
- Close: $105.
Because the close is above the open, the candle appears green under standard settings. Its body extends from $100 to $105. The upper wick covers the range from $105 to $108. The lower wick represents the movement between $97 and $100.
In this example, the open-to-close change is 5%. However, the full price range during the period is $11, reflecting the difference between the high and low. The candle alone does not reveal whether the price reached $97 or $108 first. To see that detail, you need a shorter timeframe or individual trade data.
For example, the price may have risen to $108 before falling to $97. The reverse is also possible; both paths can produce the same OHLC values.
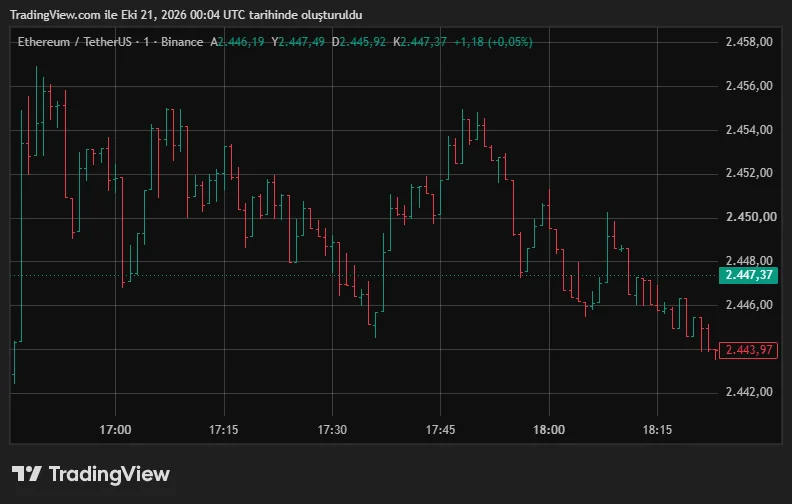
Let’s look at the example above: Each candle on the ETH/USDT chart represents one minute of price movement. The candle shown in the information bar opens at 2,446.19 USDT and reaches a high of 2,447.49 USDT. Its low is 2,445.92 USDT, while the value in the closing price field is 2,447.37 USDT. Since this value is above the opening price, the candle appears green.
The candle’s body extends from 2,446.19 to 2,447.37 USDT. Its lower wick reaches 2,445.92 USDT, while its upper wick reaches 2,447.49 USDT. This single candle therefore shows the price range within one minute.
Why does an unfinished candle change?
The candle at the far right of a chart is often still forming. As new trades occur, its body, wicks, and color can change. A one-hour candle may still have twenty minutes remaining. An apparently strong rise can weaken during that time or turn into a red close.
Therefore, avoid treating a developing candle as a completed pattern. The candle close determines its final shape for the selected period. Waiting for the close does not guarantee the next price movement. It simply reduces the risk of drawing firm conclusions from a shape that is still changing.
Basic Crypto Candlestick Patterns
Candlestick patterns are names given to specific formations involving one or several candles. In technical analysis, these structures help classify price behavior.
However, a pattern’s name alone provides limited information. The preceding trend, its location on the chart, and subsequent movements affect its interpretation.
Doji, hammer, and shooting star
A doji forms when the opening and closing prices are very close together. Its body is small, while its wicks can vary in length. This shape shows little difference between the open and close at the end of the period. Analysts may associate it with indecision, but not every doji signals a trend reversal.
A hammer has a small body near the top of the candle. Its lower wick is noticeably long, while its upper wick may be short or absent. When this structure appears after a decline, it can show that the price recovered from lower levels. Subsequent candles help assess whether that recovery continues. A shooting star has a small body near the bottom of the candle. Its long upper wick shows that the price rose before pulling back.
After an upward move, analysts may interpret it as a possible sign of weakening momentum. Similar shapes can carry different names and meanings in different trends, highlighting the importance of context.
Bullish and bearish engulfing patterns
Engulfing patterns consist of two candles. The key feature is that the second candle’s body covers the first candle’s body. In a bullish engulfing pattern, the first candle is bearish and the second is bullish. The second body engulfs the previous body.
In a bearish engulfing pattern, the first candle is bullish. The following bearish candle’s body engulfs the previous body. The second candle does not necessarily need to engulf all the wicks. A platform’s pattern definition may also include additional conditions.
For example, suppose the first candle opens at $50 and closes at $48. If the next opens at $47.50 and closes at $51, its body covers the previous body. This structure shows a notable recovery during the second period. However, subsequent candles can still move lower.
Morning star and evening star
A morning star is a three-candle structure that analysts assess after a decline. The first candle shows a clear drop, the second has a small body, and the third shows a recovery. An evening star is its bearish counterpart. It consists of a bullish candle, a small-bodied candle, and then a clearly bearish candle.
Because crypto markets trade continuously, classic price gaps do not always appear. Understanding the pattern definition in use is therefore more helpful than relying solely on visual similarity.
| Pattern | Basic appearance | Possible condition under review |
Doji | Open and close are close together | Indecision or balance |
Hammer | Small body with a long lower wick | Potential recovery after a decline |
Shooting star | Small body with a long upper wick | Potential weakening after a rise |
Bullish engulfing | A bullish body engulfs the previous bearish body | Potential strengthening of buying pressure |
Bearish engulfing | A bearish body engulfs the previous bullish body | Potential strengthening of selling pressure |
Morning star | Bearish candle, small body, bullish candle | Possible upward reversal |
Evening star | Bullish candle, small body, bearish candle | Possible downward reversal |
This table offers a starting point for recognizing patterns. None of these formations constitutes a standalone instruction to buy or sell.
Reading Candles Alongside Volume, Trends, and Price Levels
A candle’s location on the chart matters as much as its shape. Two similar candles can carry different implications under different market conditions.
Crypto technical analysis therefore involves assessing candles alongside other data. The aim is to gather more information about the same price movement.
What does trading volume show?
Trading volume shows how much trading occurred during a particular period. A platform may express it in units of the asset or monetary value. A long candle indicates that the price moved across a wide range. However, it does not reveal how much trading occurred; volume provides that information.
For example, volume may increase as the price moves above an important level. Analysts may interpret this as a move accompanied by greater trading activity. However, rising volume does not guarantee that an upward move will continue. Heavy selling or short-lived panic can also generate high volume.
Every trade also has both a buyer and a seller. Therefore, do not interpret a green volume bar as meaning that “only buying occurred.”
Volume is a separate data point that complements the price chart.
Support, resistance, and the current trend
Support refers to an area where the price previously reacted during a decline. Resistance describes an area where the price previously struggled during a rise. These areas are not precise, unbreakable barriers. The price may fluctuate around a level or move through the entire zone.
Suppose a hypothetical asset has recovered several times around $20. A later candle with a long lower wick in the same area offers an observation worth examining. However, a close below $20 followed by sustained trading below that level may weaken the earlier expectation. When assessing a pattern, also consider what would invalidate your interpretation.
To assess a trend, you can look for higher highs and higher lows, or lower highs and lower lows. In a sideways market, the price may move within a particular range. Broader market conditions and news can outweigh chart patterns. It is therefore unwise to associate the same shape with the same outcome in every situation.
An example chart-review process
When learning to read charts, you can follow a consistent review process. This helps prevent you from attaching too much significance to the first shape you notice.
- Check the trading pair and the currency used to express the price.
- Identify the timeframe.
- Examine the trend in the broader view.
- Read the candle’s open, close, high, and low.
- Compare its body and wicks with nearby candles.
- Assess volume and important price areas.
- Check whether the candle has closed.
- Note any information that contradicts your initial interpretation.
For example, keep your observation specific when you see a long lower wick. Avoid immediately concluding that buyers have definitely taken control.
“The price fell during the period, then closed away from its low” describes what the candle directly shows.
Common Mistakes When Reading Crypto Candlestick Charts
Learning candlestick charts involves more than memorizing pattern names. You also need to understand what information the chart shows and what it leaves out. Especially in fast-moving markets, rushed interpretations can turn a limited observation into a firm expectation.
Drawing definite conclusions from a single candle
One green candle does not prove that a downtrend has ended. A long red candle does not guarantee that the price will fall during the next period.
Common mistakes include:
- Treating an unfinished candle as a completed pattern.
- Calling every long lower wick a hammer.
- Sharing a chart without specifying its timeframe.
- Treating one pattern as a guaranteed reversal signal.
- Selecting only candles that support an existing expectation.
- Ignoring volume and market conditions.
Patterns classify past and current price behavior. They do not predetermine the prices at which future trades will occur.
Confusing standard candles with Heikin Ashi
Some chart types display prices using different calculations. Unlike standard candles, Heikin Ashi uses calculated opening and closing values. This method can make price movements appear smoother. However, the displayed values may differ from the actual opening and closing prices for the period. Always check the chart type before interpreting its candles. Applying standard candlestick-reading rules identically to every chart type can be misleading.
Frequently Asked Questions (FAQ)
Below are some frequently asked questions and answers about crypto candlestick charts.
- What is the difference between a crypto candlestick chart and a line chart?: A line chart usually connects closing prices for the selected periods. A candlestick chart displays the open, close, high, and low together. It therefore provides more detail about movement within each period.
- Does a green candle mean the price will keep rising?: No. A standard green candle means its closing price is higher than its opening price. It does not guarantee the direction of the next period.
- What does a long wick mean?: It shows that the price reached a level beyond the body and then moved back. To understand why, examine the surrounding candles and market data.
- Why does the candle close matter?: An unfinished candle can change its shape and color. The close establishes its final appearance for the selected period, but it does not determine the next move.
- Which candlestick pattern is the most reliable?: No single pattern produces certain results across every market and timeframe. Its location, market conditions, and the evaluation method all affect the outcome.
- Can you trade using candlestick charts alone?: Candles help you examine price behavior, but they do not reveal every risk. Trading costs, liquidity, and unexpected news can also affect the outcome.
Explore JrKripto’s guides to cryptocurrency basics, tokenomics, and the Fear and Greed Index to better understand price movements.

