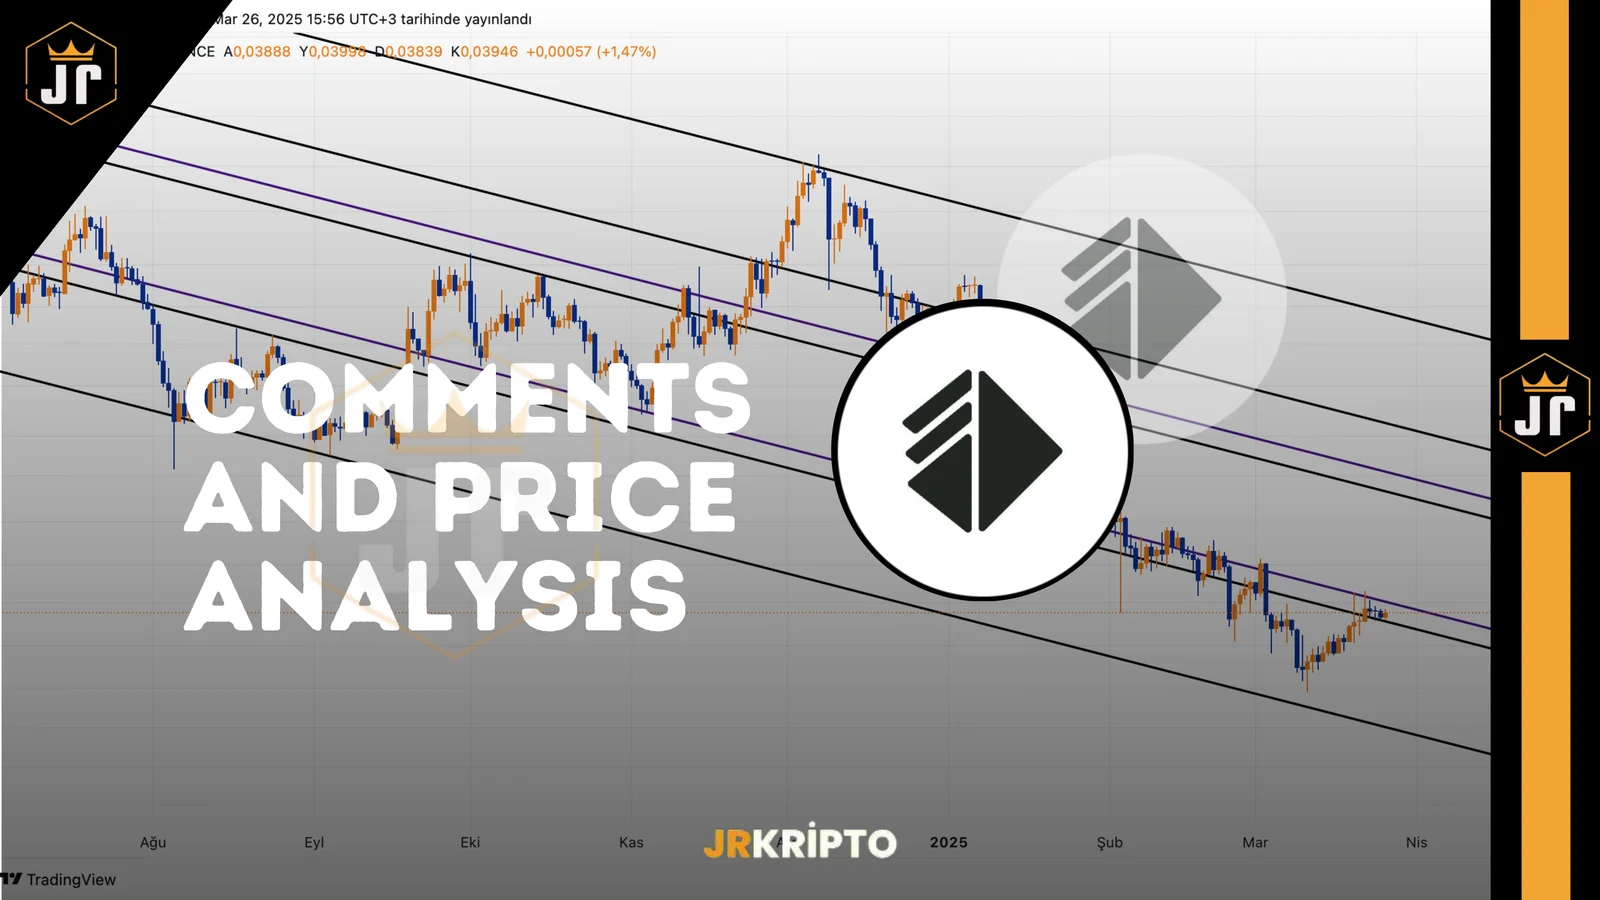
AltLayer (ALT) Technical Analysis: Testing the Channel Resistance
AltLayer has been trading within a descending channel pattern for quite some time. As of now, the ALTUSDT pair is priced at $0.03983, which is hovering close to both the upper boundary of the descending channel and a short-term horizontal resistance zone. The technical setup suggests that a breakout above this level could trigger a potential recovery move.
Price Action Overview
Over the past few months, AltLayer has been forming lower highs and lower lows amid ongoing bearish pressure. However, recent price consolidation near the upper edge of the channel indicates that the downward momentum might be weakening. This sideways movement could be a precursor to a trend reversal.
Key Technical Levels for ALTUSDT
Support Zones:
- $0.02950 – Lower boundary of the channel
- $0.03500 – Short-term support
- $0.04451 – May flip to support after a confirmed breakout
Resistance Zones:
- $0.04451 – Channel top + horizontal resistance
- $0.05741 – $0.06252 – Medium-term resistance range
- $0.07854 – Previously a strong reaction area
- $0.09896 – $0.10744 – Major resistance zone
- $0.13859 and $0.20908 – Long-term target levels
If the price manages to break above the $0.04451 resistance, the next target will be the $0.05741 – $0.06233 range. This area is crucial from both a technical and psychological standpoint, having served as a reversal zone in past price movements.
Descending Channel & Market Structure
The descending channel in the chart highlights AltLayer’s controlled yet steady decline. Such formations often signal potential for sudden directional shifts. The frequent touches on the channel’s upper boundary increase the likelihood of an upward breakout.
Strategy for Traders
- Breakout Confirmation: A close above $0.04451 could trigger a bullish scenario.
- Volume Analysis: Breakouts with strong volume are more sustainable; low-volume rallies may be false signals.
- Support Monitoring: A close below $0.03500 would signal a continuation of the downtrend.
AltLayer at a Critical Juncture
AltLayer is currently testing the upper limit of its descending channel. Technical indicators point toward the potential for short-term bullish momentum if this level is breached with strong volume. A confirmed breakout above $0.04451would set the first upward target at around $0.05759.
The current price compression and horizontal consolidation within the channel suggest that a new trend could be forming. As such, AltLayer is at a technically pivotal level, and the price action in the coming days will be crucial in determining its direction.
Disclaimer: This analysis does not constitute financial advice. It is intended for informational purposes only and highlights potential support and resistance zones based on market conditions. All trading decisions and risk management are the sole responsibility of the trader. Stop-loss usage is strongly recommended when entering any position.