
ZRO Technical Analysis
On the ZRO chart, the price action is currently squeezed within a broadening symmetrical triangle. Since March, the formation of higher lows had raised expectations of a bullish breakout. However, the upper resistance line near the $2.96 level has yet to be breached. At the time of writing, the price is trying to hold above the key support zone around $2.10–$2.20.
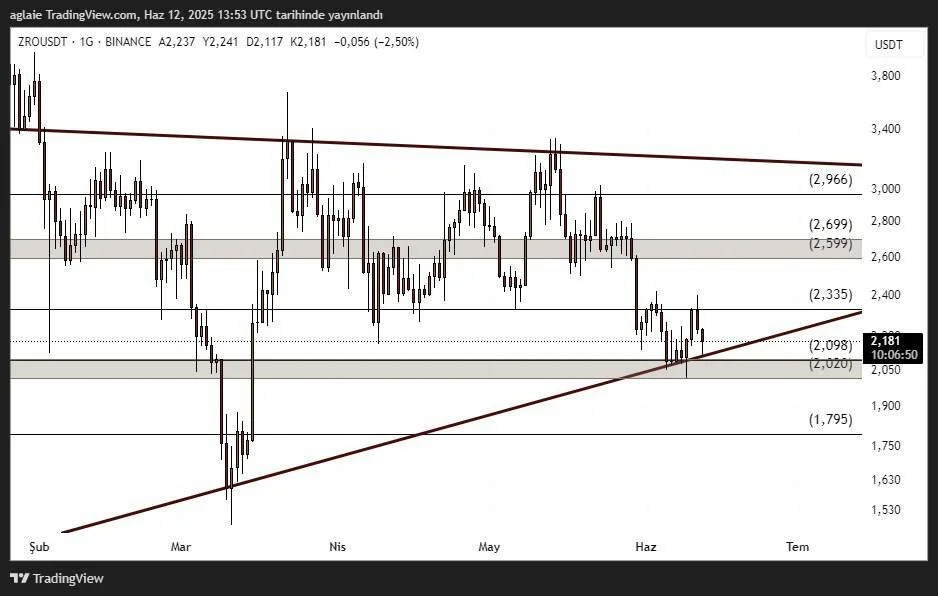
The rising trendline seen on the chart recently acted as support during the latest dip, triggering a mild bounce. Still, the horizontal resistance between $2.33 and $2.35 remains firm. Unless this zone is broken convincingly, any upward move may struggle to gain momentum. A breakout above this resistance could open the path toward $2.60–$2.70, with the $2.96 level as a subsequent target.
On the downside, the first key support lies between $2.10 and $2.05. If the price closes below this zone, the risk of a deeper correction increases, with a possible retracement toward $1.80–$1.79. This area is crucial both as a previous demand zone and because it lies just below the ascending trendline support.
In summary, ZRO is at a decisive point on the chart. While the higher lows send a bullish signal, confirmation will only come with a breakout above horizontal resistance. Especially daily closes above $2.33 could ignite a strong rally.
Disclaimer: This analysis does not constitute investment advice. It focuses on support and resistance levels that may present potential short- to mid-term trading opportunities depending on market conditions. However, all responsibility for trading decisions and risk management lies entirely with the user. The use of stop-loss orders is strongly recommended for any trade setup shared.


