
ZK Technical Analysis and Breakout of the Falling Wedge
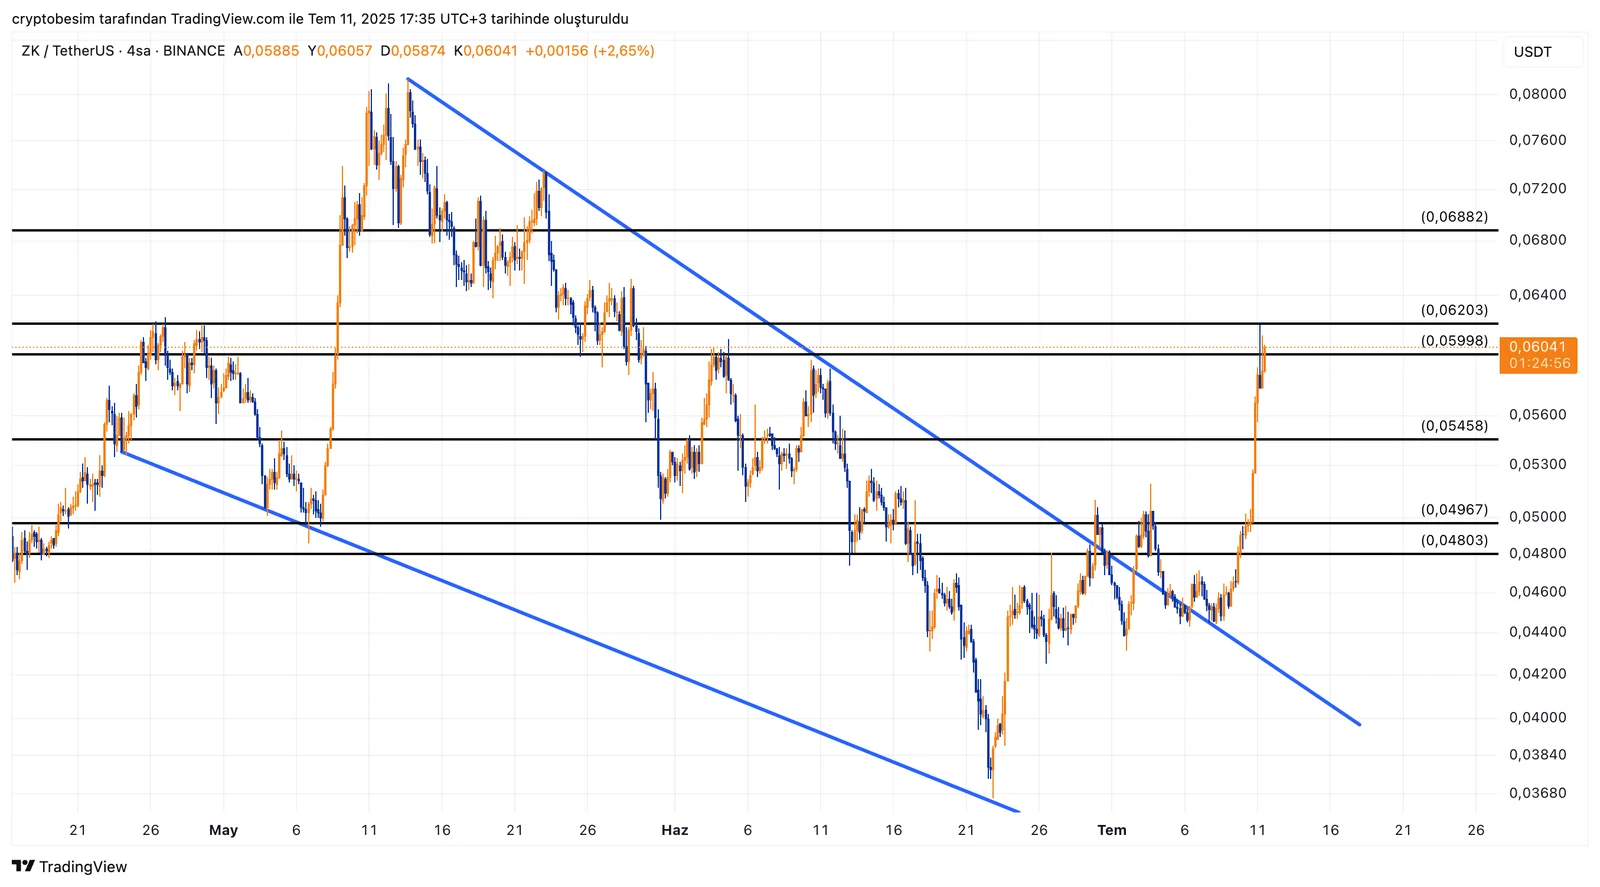
The ZK chart has been printing a clear falling wedge pattern. In line with technical expectations, the upward breakout of this falling wedge continues the positive atmosphere. The retest following the breakout demonstrated that the formation worked healthily and triggered a strong upward movement from this area.
In short:
- Falling wedge formation broke out upward.
- Retest done following the breakout.
- $0.060 – $0.062 zone is strong resistance.
- $0.054 and $0.050 should be monitored as support in case of pullbacks.
These analyses, not offering any kind of investment advice, focus on support and resistance levels considered to offer trading opportunities in the short and medium term according to the market conditions. However, the user is responsible for their own actions and risk management. Moreover, it is highly recommended to use stop loss (SL) during the transactions.


