
ZK Technical Analysis
ZK has once again touched its ascending trendline and successfully bounced from that region. The $0.0579–$0.0592 range stands out as a strong support zone, intersecting both horizontal and trendline supports. After testing this level, the price has reversed upward and is currently trading around $0.0643.
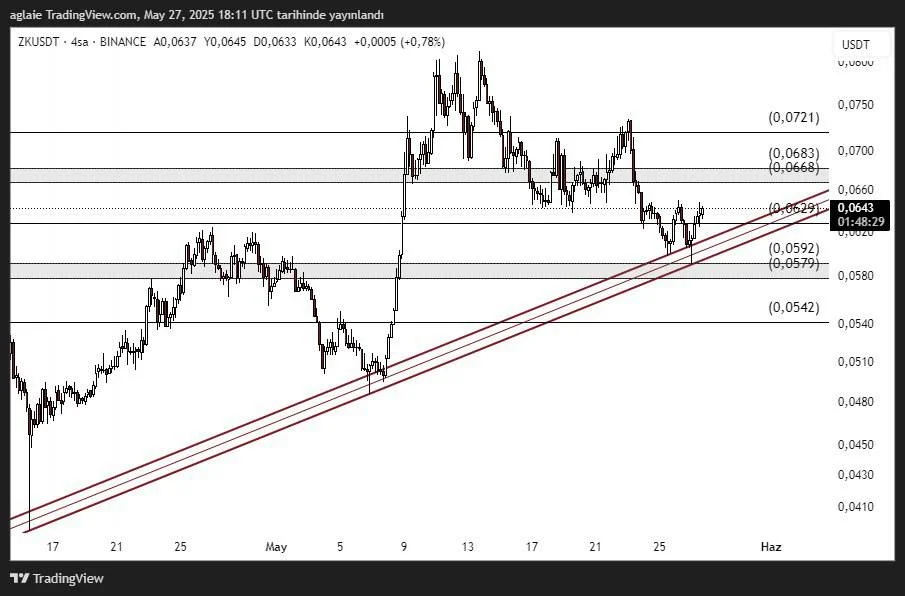
The structure on the chart highlights $0.0629 as a key short-term resistance level. As long as this level remains unbroken, further upside could be limited. However, a clear breakout above $0.0629 may pave the way for a move toward the $0.0668–$0.0683 resistance zone — an area where price previously faced sharp rejections.
Support Levels:
- $0.0629: Currently acting as short-term resistance; a breakout may trigger upside continuation
- $0.0592–$0.0579: Key support area combining trendline and horizontal support
- $0.0542: Deeper support in case of a strong breakdown
Resistance Levels:
- $0.0668–$0.0683: Critical resistance zone that may define the next price direction
- $0.0721: Next major resistance level
The ascending trend remains intact, and the current price structure shows a series of higher lows. What matters now is whether ZK can sustain upward momentum and break above recent resistance levels. A confirmed breakout and hold above $0.0668 would likely indicate the beginning of a new bullish leg.
Disclaimer: This analysis does not constitute investment advice. It focuses on support and resistance levels that may present potential short- to mid-term trading opportunities depending on market conditions. However, all responsibility for trading decisions and risk management lies entirely with the user. The use of stop-loss orders is strongly recommended for any trade setup shared.


