
ZK Technical Analysis
The ZK chart reveals a narrowing triangle formation, with price action increasingly compressed between a descending resistance line and an ascending support trend. This setup signals that the asset is approaching a key decision point, and a directional breakout could occur in the near term.
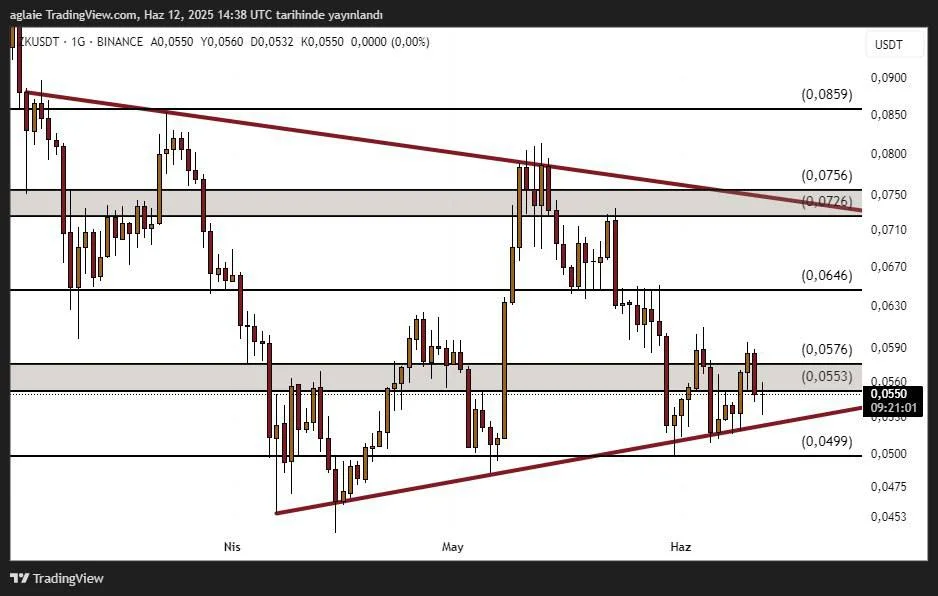
The $0.050–$0.051 zone stands out as a crucial support area. Bounces from this region have helped maintain the structure of higher lows, preserving the bullish potential of the formation. On the upside, $0.0576 and $0.0646 serve as intermediate resistance levels. The main resistance lies between $0.0726 and $0.0756—a zone that aligns with both horizontal resistance and the triangle’s upper boundary. This region must be broken to confirm a bullish breakout.
If ZK breaks out upward from this tightening range, initial targets could include $0.0646, $0.0726, and eventually $0.0859. Conversely, if the triangle breaks to the downside, support levels at $0.0499 and $0.0475 should be closely watched. A breakdown below these levels could weaken the current bullish structure.
In summary, the ZKUSDT chart is setting the stage for a potentially decisive breakout. Traders should monitor key support and resistance levels carefully, as the direction of the breakout will likely define the next major trend.
Disclaimer: This analysis does not constitute investment advice. It focuses on support and resistance levels that may present potential short- to mid-term trading opportunities depending on market conditions. However, all responsibility for trading decisions and risk management lies entirely with the user. The use of stop-loss orders is strongly recommended for any trade setup shared.


