
XRP Technical Analysis
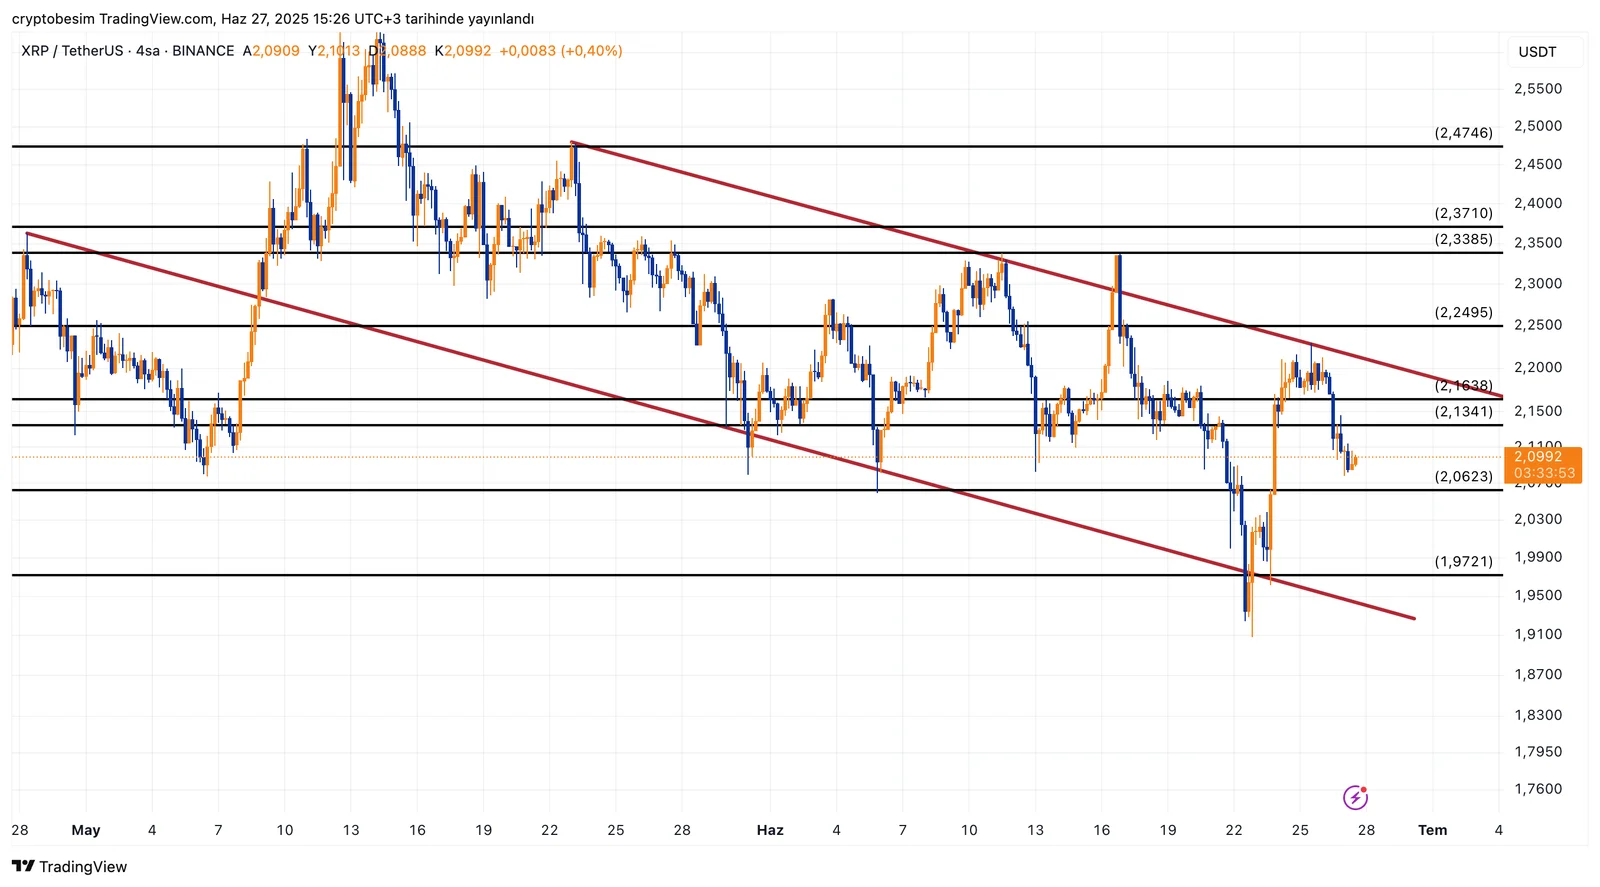
There is a descending channel pattern on the short-term chart of XRP. In spite of the price violations in this pattern, the price has managed to hold within this channel. The price of the coin fell after it was rejected on June 25th. Later, XRP fell below the support zone of $2.1–$2.13. If we see daily closings below this important support, the price could go down to the support level of $2.06.
However, if the price receives great buy volume and manages to rise above $2.16 again, we can say that next trend test is on the way, which technically could be a trend break. XRP will swiftly rise towards the $2.33–$2.37 resistance zone if the descending trend pattern is over. This zone has previously worked as a strong resistance area horizontally; still, it is safe to say that this resistance has weakened after so many tests to it. We have the level $2.47 after $2.37.
If the price cannot pass $2.16, we have the support level $2.06 as stated above. Below this level, there is both the horizontal support level at $1.97 and the lower trend support of the descending channel.
These analyses, not offering any kind of investment advice, focus on support and resistance levels considered to offer trading opportunities in the short and medium term according to the market conditions. However, the user is responsible for their own actions and risk management. Moreover, it is highly recommended to use stop loss (SL) during the transactions.


