
WLD/USDT – Daily Technical Analysis
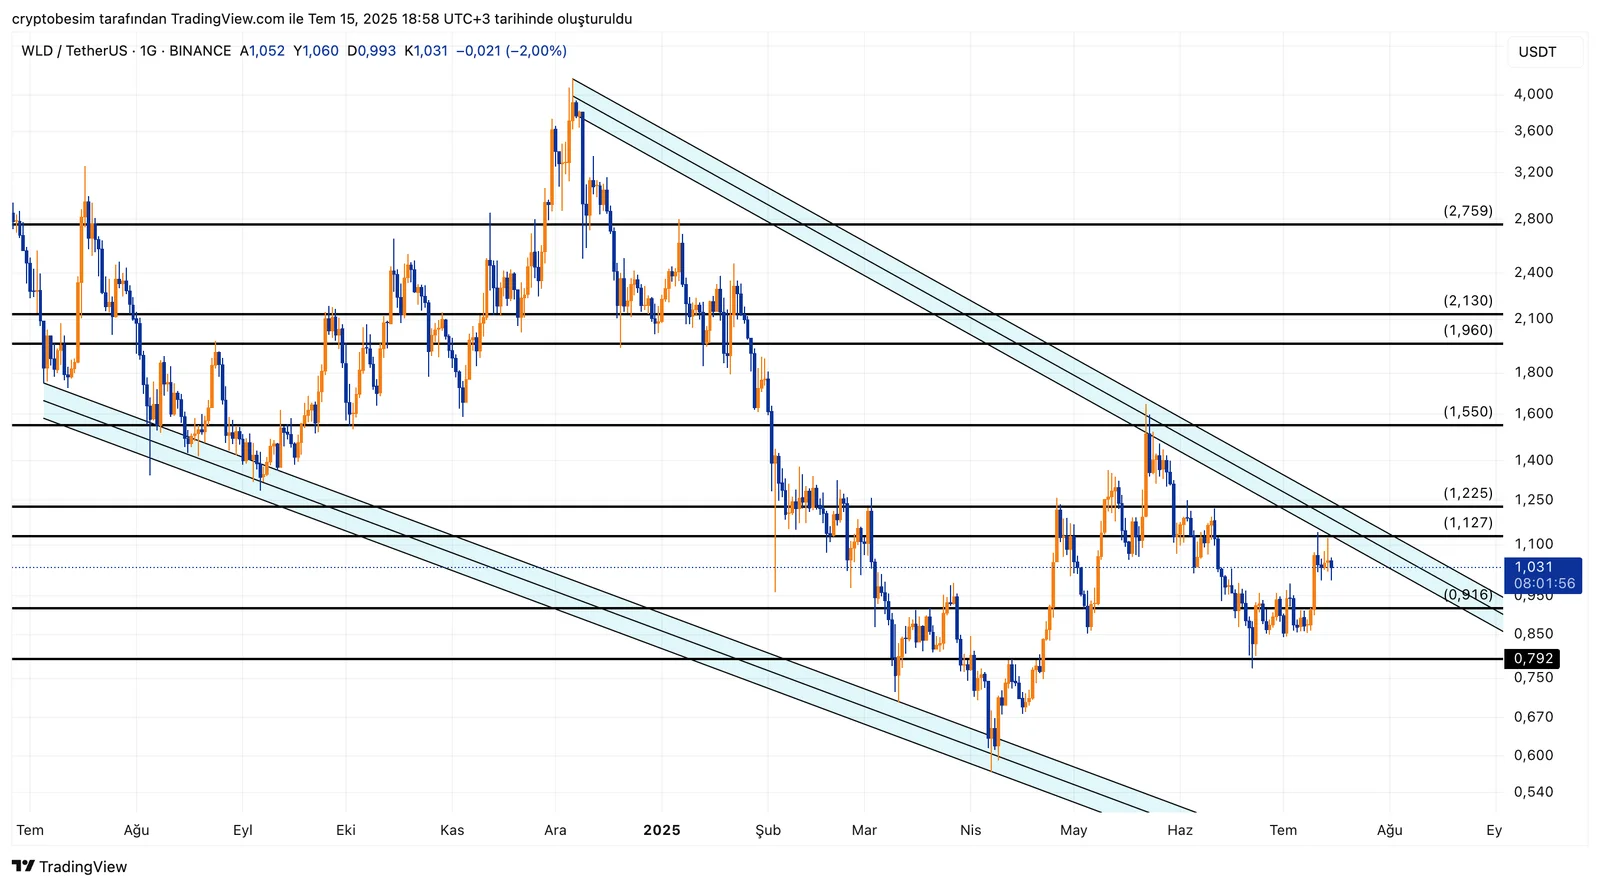
Looking at the WLD chart on the daily timeframe, we see that the price is rising within a falling wedge formation and reconnecting with the upper resistance line of this pattern. It is well known that such a formation usually tends to break out upwards in the end. The price is currently trading around $1.127, which coincides with this trend resistance.
A breakout of this resistance could trigger a bullish rally toward higher levels such as $1.225 → $1.550 → $1.960 → $2.130 in the short term. If these resistance levels are broken with strong momentum, we can say that $4 could be the mid-term price target.
However, if the price gets rejected and pulls back from this resistance level, the first support to follow would be $0.916, below which lies a strong support at $0.792.
If the falling wedge formation breaks upward and holds, then WLD could enter a strong mid-term uptrend.
Summary:
- A falling wedge formation is visible on the chart.
- The price just tested the upper border trend resistance.
- If broken above, resistance levels of $1.225 → $1.550 → $1.960 → $2.130 should be followed.
- The wedge formation’s mid-term target is $4.
- In case of a pullback, $0.916 and $0.792 should be watched as key supports.
These analyses, not offering any kind of investment advice, focus on support and resistance levels considered to offer trading opportunities in the short and medium term according to the market conditions. However, the user is responsible for their own actions and risk management. Moreover, it is highly recommended to use stop loss (SL) during the transactions.


