
USUAL Technical Analysis
Analyzing the USUAL chart on a daily time frame, we see that it is struggling to break out of the descending channel which has been active for 6 months. Meanwhile, the cup and handle formation we see on the chart indicates that the downtrend has ended and the uptrend potential has increased.
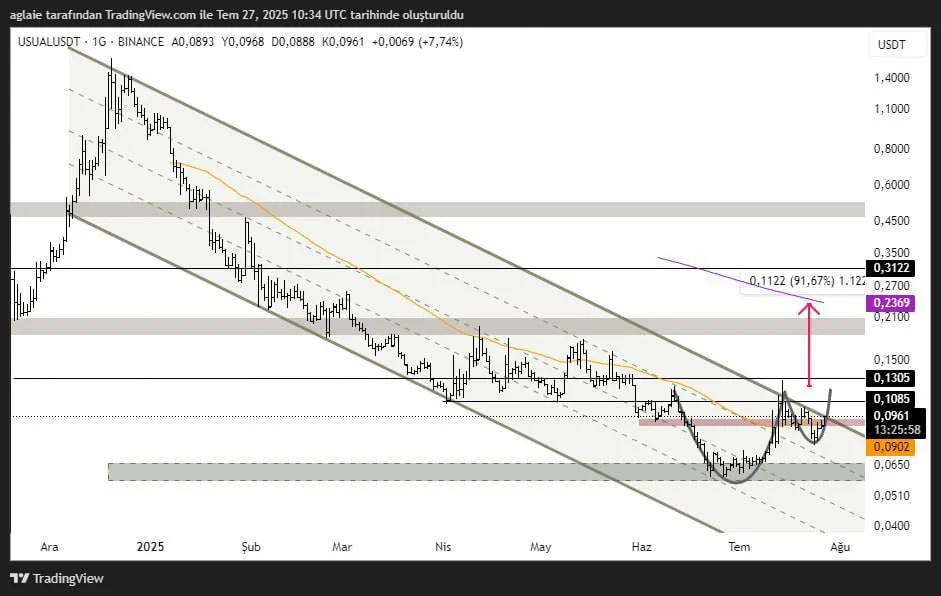
According to the chart, the nearest support zone is around the levels at $0.0902 – $0.0960, which also acts as the horizontal resistance and as the neckline of the formation. Should the price hold above this level, buyer interest might increase and we can see the cup-handle formation be complete if the downtrend gets broken in the short term.
In terms of resistance levels, the levels at $0.1085 and $0.1305 stand out. This resistance area previously worked as support but it has now reversed its support-resistance transition, meaning that sellers are more dominant than buyers here. However, the most important area is the range between the levels of $0.2369 – $0.2700 which stands as a strong resistance long dominated by sellers. Moreover, the chart highlights that a rise to this level has a potential of approximately 91%, a scenario which is consistent with the technical projection of the cup-and-handle formation.
The next resistance ahead is the level at $0.3122 if the formation target is exceeded. Remember that this level serves as a psychologically important point since it refers to the level where the main fall started previously.
These analyses, not offering any kind of investment advice, focus on support and resistance levels considered to offer trading opportunities in the short and medium term according to the market conditions. However, the user is responsible for their own actions and risk management. Moreover, it is highly recommended to use stop loss (SL) during the transactions.


