
UNI Technical Analysis
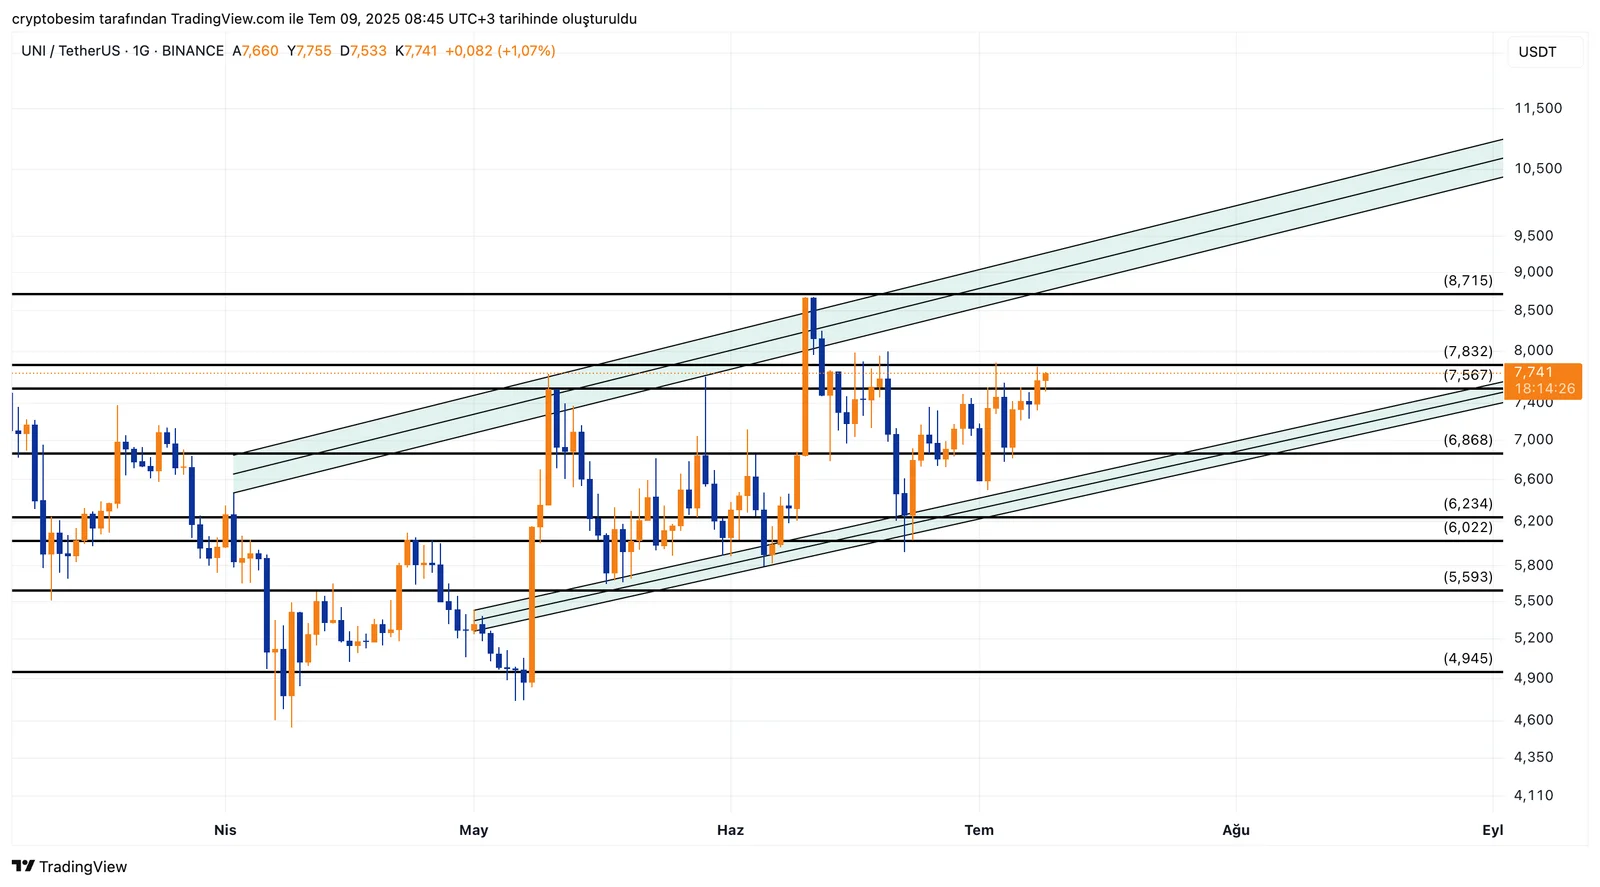
Looking at the UNI daily chart, we see that an ascending channel pattern has been forming. Resistance zone $7.56–$7.83 at the middle boundary of this formation seems very strong. This price zone being mentioned has worked as resistance many times before and the price has been rejected from here. UNI is now at the same price level again. If broken above, the price has the potential to trigger a great rise. It is highly possible to see a movement to the upper trend zone around $9 if the level $7.83 is passed. In case the price gets rejected from this resistance zone again, it may retreat to the first support level $6.88 and then to the trend support around $6.30 in the lower zone.
These analyses, not offering any kind of investment advice, focus on support and resistance levels considered to offer trading opportunities in the short and medium term according to the market conditions. However, the user is responsible for their own actions and risk management. Moreover, it is highly recommended to use stop loss (SL) during the transactions.


