
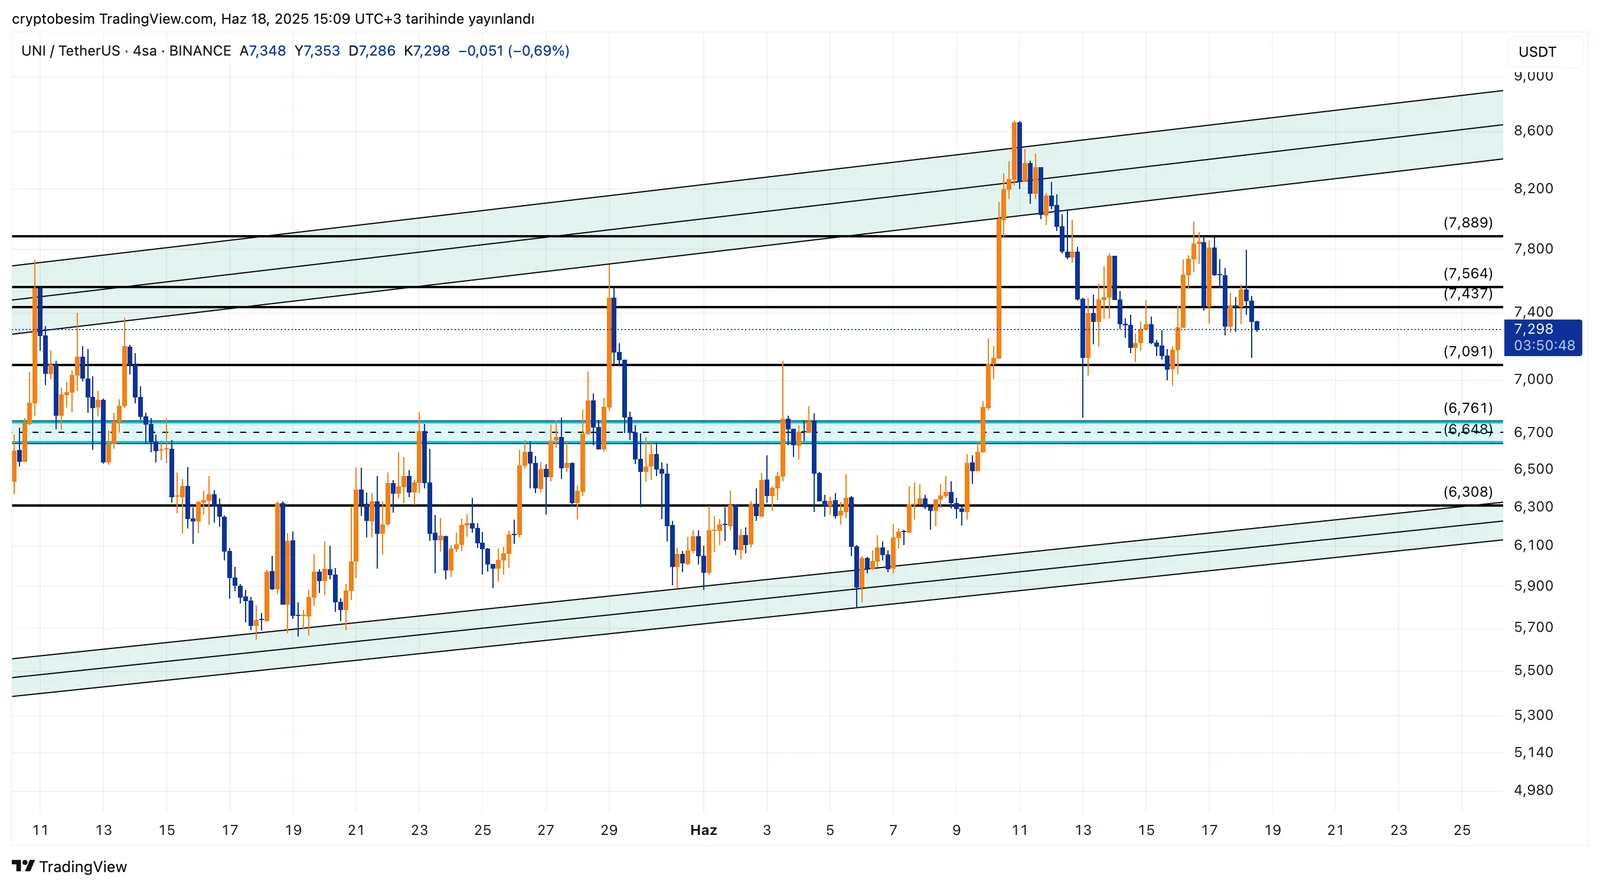
UNI Technical Analysis
Looking at the UNI chart, it is clear that the price is trading within a certain ascending channel. The price, being rejected twice from the upper trend of the channel recently, has fallen below the horizontal support zone between $7.56–$7.43. If the price stays below this support zone, it could pull back to $7 – the middle band of the channel. The focus must be on the major zone in the $6.64–$6.76 range. Should this area get lost, the price could go down to the trend support level – around $6. The most significant level requiring attention is the middle band area, which is around $6.70.
However, it can be stated that the big picture demonstrates high peaks and a positive outlook. In case the price breaks upwards, then the target would be as long as the channel length.
These analyses, not offering any kind of investment advice, focus on support and resistance levels considered to offer trading opportunities in the short and medium term according to market conditions. However, the responsibility for making transactions and risk management belongs entirely to the user. In addition, it is strongly recommended to use stop loss (SL) in relation to shared transactions.


