
TOSHI Technical Analysis
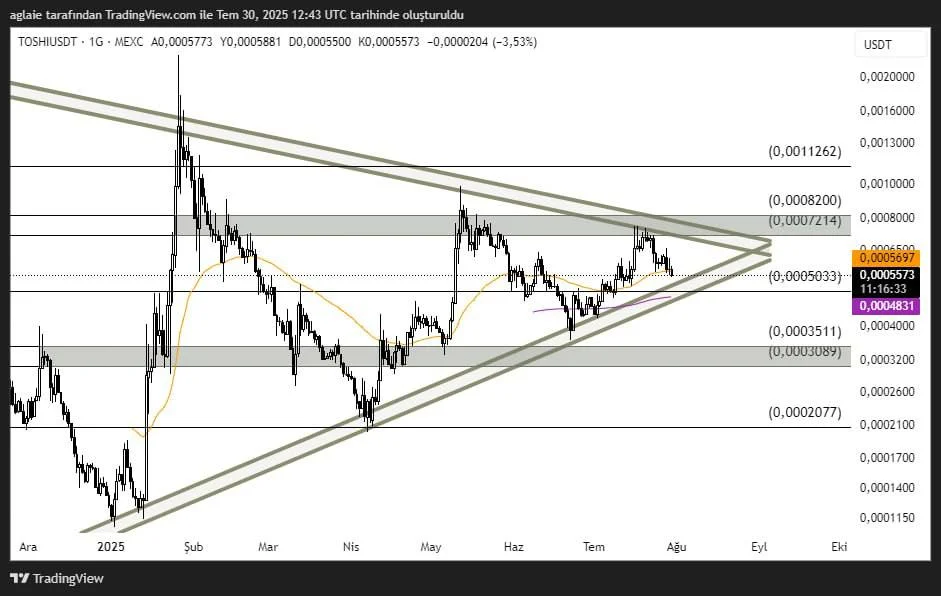
Analyzing the TOSHI chart on a daily time frame, we can see the clear symmetrical triangle pattern, and the price keeps contracting within this formation through higher lows and lower highs. It is currently trading close to the mid-border of the triangle formation at around $0.00055–$0.00056, which serves as both support and a potential reaction zone. The upper and lower convergence points of the triangle are classically considered potential breakout areas.
We see that the upper border of the triangle formation is around the range of $0.00072–$0.00082, and it is hard to get a confirmation for an upward move unless this range is exceeded. The level at around $0.00112 could be a potential target if we can see price closings above this key range.We have the support level at $0.00050 below, and if it gets broken downwards, we can see a pullback towards the range between the levels at $0.00035–$0.00030.
These analyses, not offering any kind of investment advice, focus on support and resistance levels considered to offer trading opportunities in the short and medium term according to the market conditions. However, traders are responsible for their own actions and risk management. Moreover, it is highly recommended to use stop loss (SL) during trades.


