
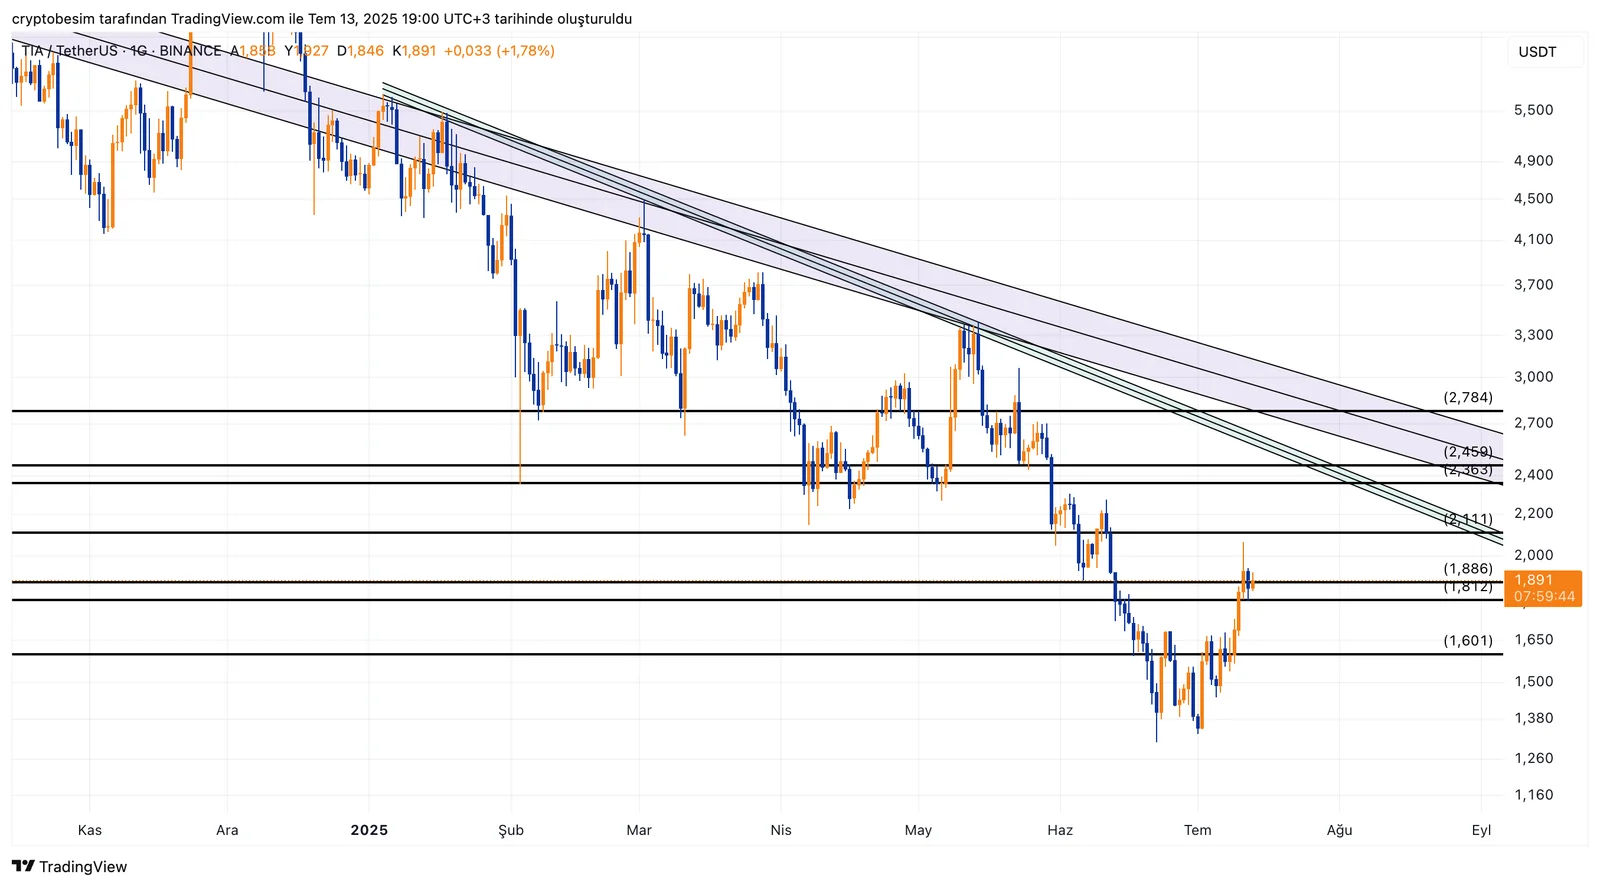
TIA Technical Analysis
TIA is clearly having difficulty breaking the level of $1.88, which is horizontal resistance and the area where previous Fibonacci levels are concentrated. If the price can hold above this key level, the first target will be the range between $2.38 - $2.45, which marks the downtrend line at the same time. In other words, the price will see some pressure here as the horizontal level and the trend will actively work. If the price can hold above $1.88, the way to the higher levels until $2.50 will be open. However, if TIA gets rejected from this level, the range between $1.87 - $1.72 and $1.60 should be followed.
Summary:
- $1.88 seems to be a strong resistance.
- The first target will be $2.38 - $2.45 if the price can hold above $1.88.
- The level $1.88 coincides with the trendline.
- Above $2.45, the next target will be $2.50.
- If it gets rejected, $1.87, $1.72, and $1.60 should be followed respectively.
These analyses, not offering any kind of investment advice, focus on support and resistance levels considered to offer trading opportunities in the short and medium term according to the market conditions. However, the user is responsible for their own actions and risk management. Moreover, it is highly recommended to use stop loss (SL) during trades.


