
TIA Short Term Technical Analysis
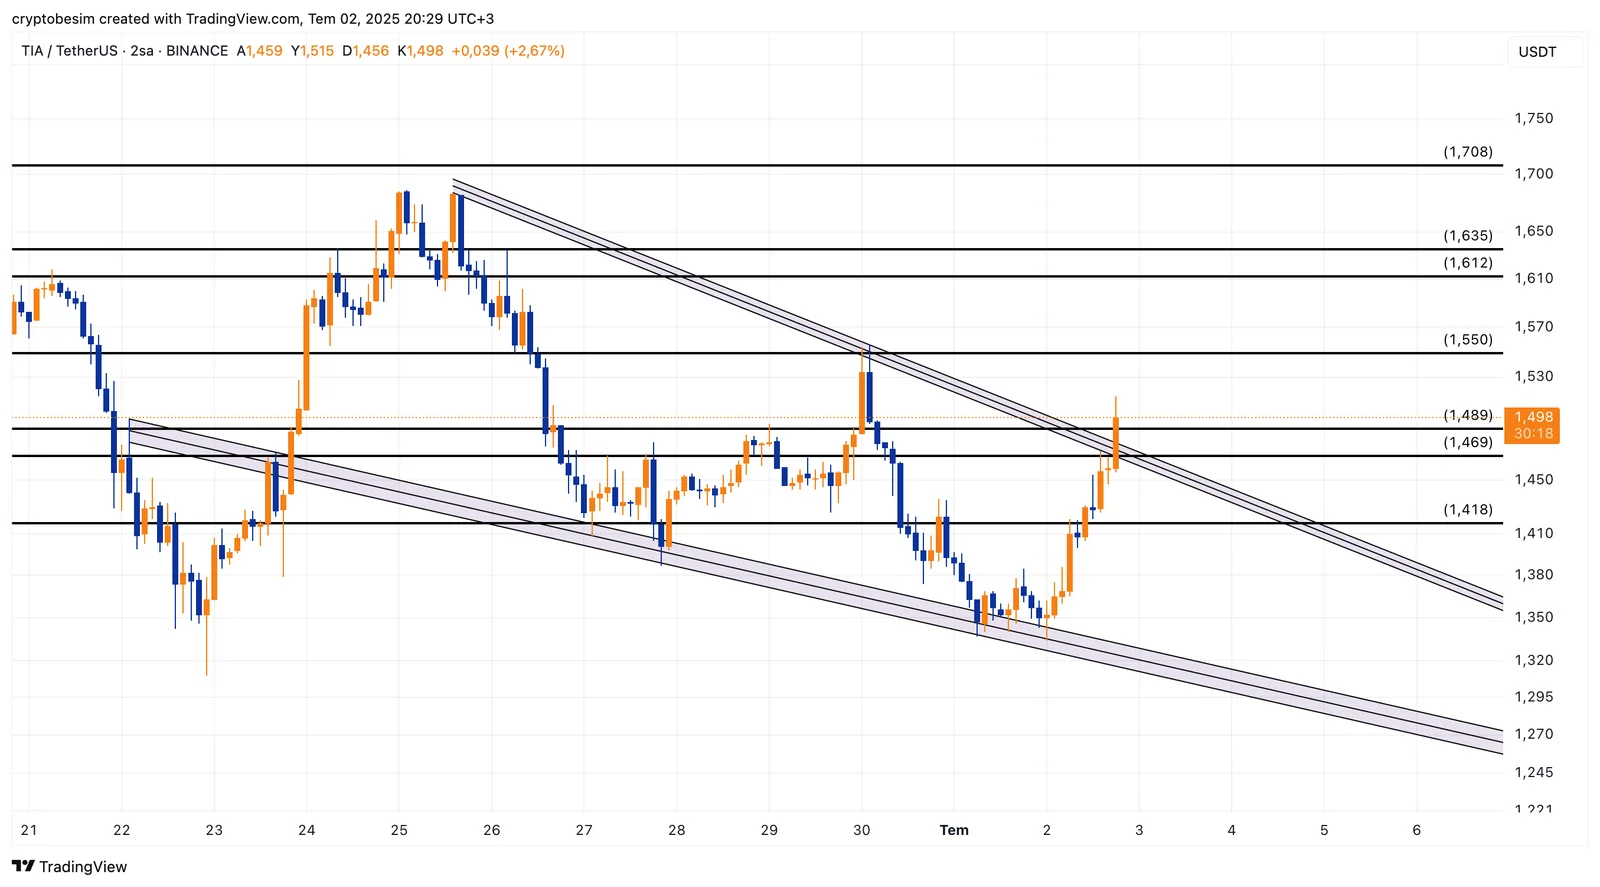
TIA has technically printed a falling wedge formation on the short-term chart. It is clear that the third test and a breakout just occurred. This area, which the price tested and broke out, was a horizontal resistance area as well as a trend resistance. In case of a pullback after the breakout, this resistance area will work as a support. We already stated that the target of the falling wedge formation is an upward breakout. Currently, the targets are $1.55, $1.61–$1.63 area, and $1.70. In case of pullbacks, we expect the $1.47–$1.49 area to work as a strong support, below which the price might enter the falling wedge formation again.
These analyses, not offering any kind of investment advice, focus on support and resistance levels considered to offer trading opportunities in the short and medium term according to the market conditions. However, the user is responsible for their own actions and risk management. Moreover, it is highly recommended to use stop loss (SL) during the transactions.


