
TIA Technical Analysis
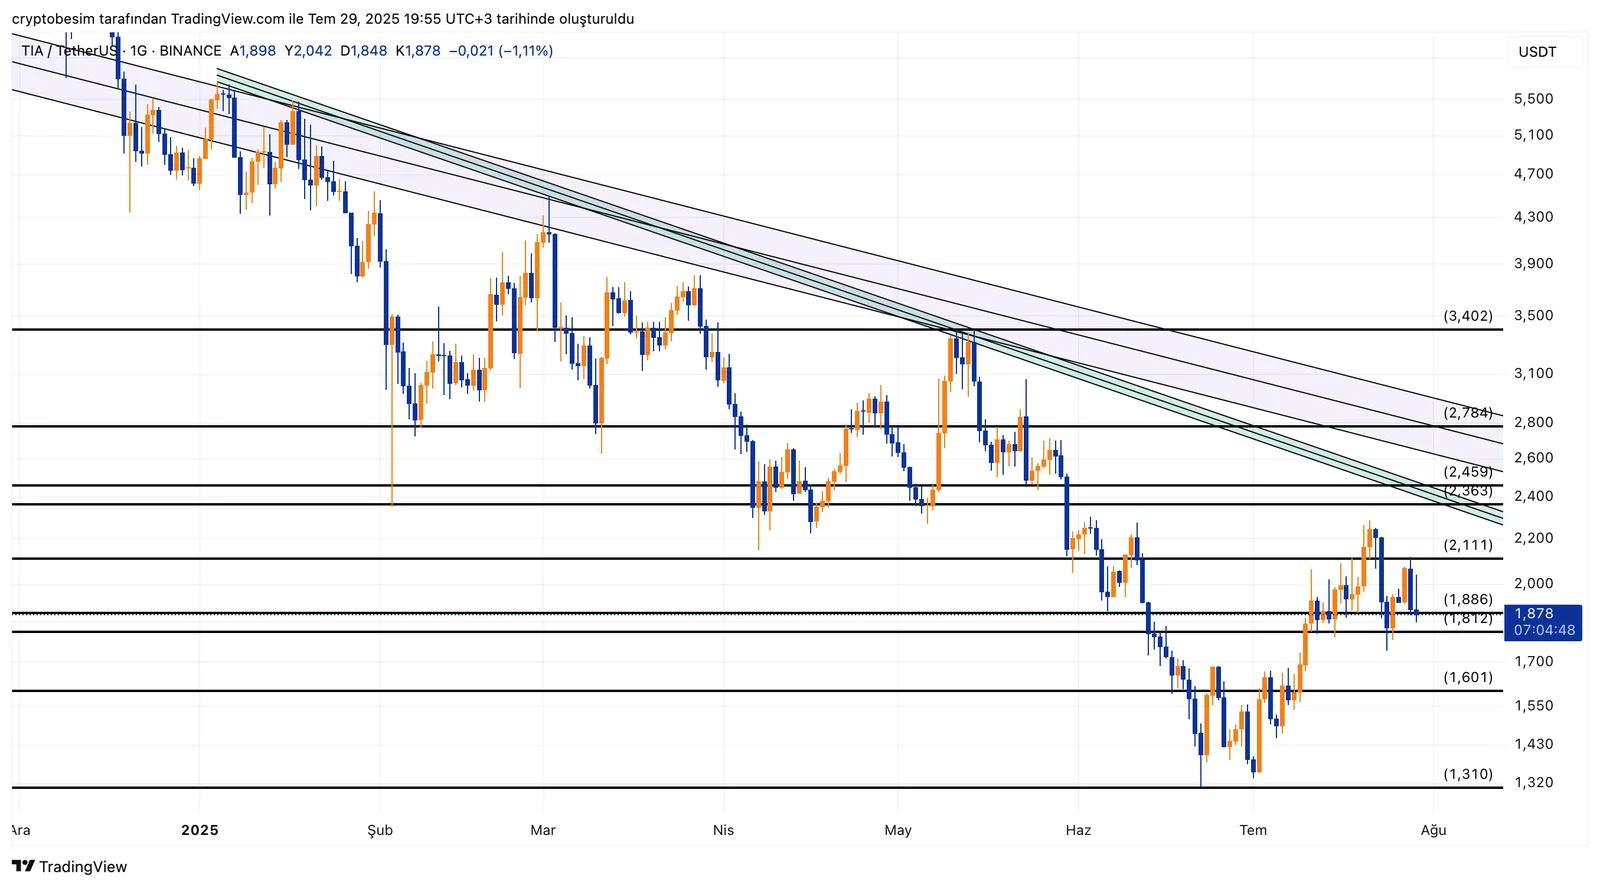
Looking at the TIA chart, we can say that the downtrend pattern which has been active for a long period of time is still valid. Though the price drew near to this downtrend zone again with the help of the latest upward movement, it was rejected at the level of $2.11 and went into a correction.TIA is trading around the level at $1.878, and this level coincides with the short-term support line between the levels at $1.88 and $1.81. As long as this range is maintained, the price could be propelled upward. Moreover, if we see a break above the resistance level of $2.11, the price could rapidly surge to the target range between the levels at $2.36 and $2.45.On the other hand, we have a support zone between the levels at $1.60 and $1.43 to follow in case the downward pressure intensifies and the level of $1.81 gets broken. At this level, we expect that buyer interest will increase.
Summary:
- Price: $1.878
- Short-term support: $1.81
- Resistance area: $2.11
- Targets in case of an upside breakout: $2.36 → $2.45 → $2.78
- Support in case of a downside scenario: $1.60 → $1.43 → $1.31
The downtrend in TIA has not yet been broken. A break above the $2.11 resistance level will provide clearer trend reversal signals. Otherwise, support areas should be closely monitored.
These analyses, not offering any kind of investment advice, focus on support and resistance levels considered to offer trading opportunities in the short and medium term according to the market conditions. However, the user is responsible for their own actions and risk management. Moreover, it is highly recommended to use stop loss (SL) during trades.


