
TIA/USDT Technical Analysis
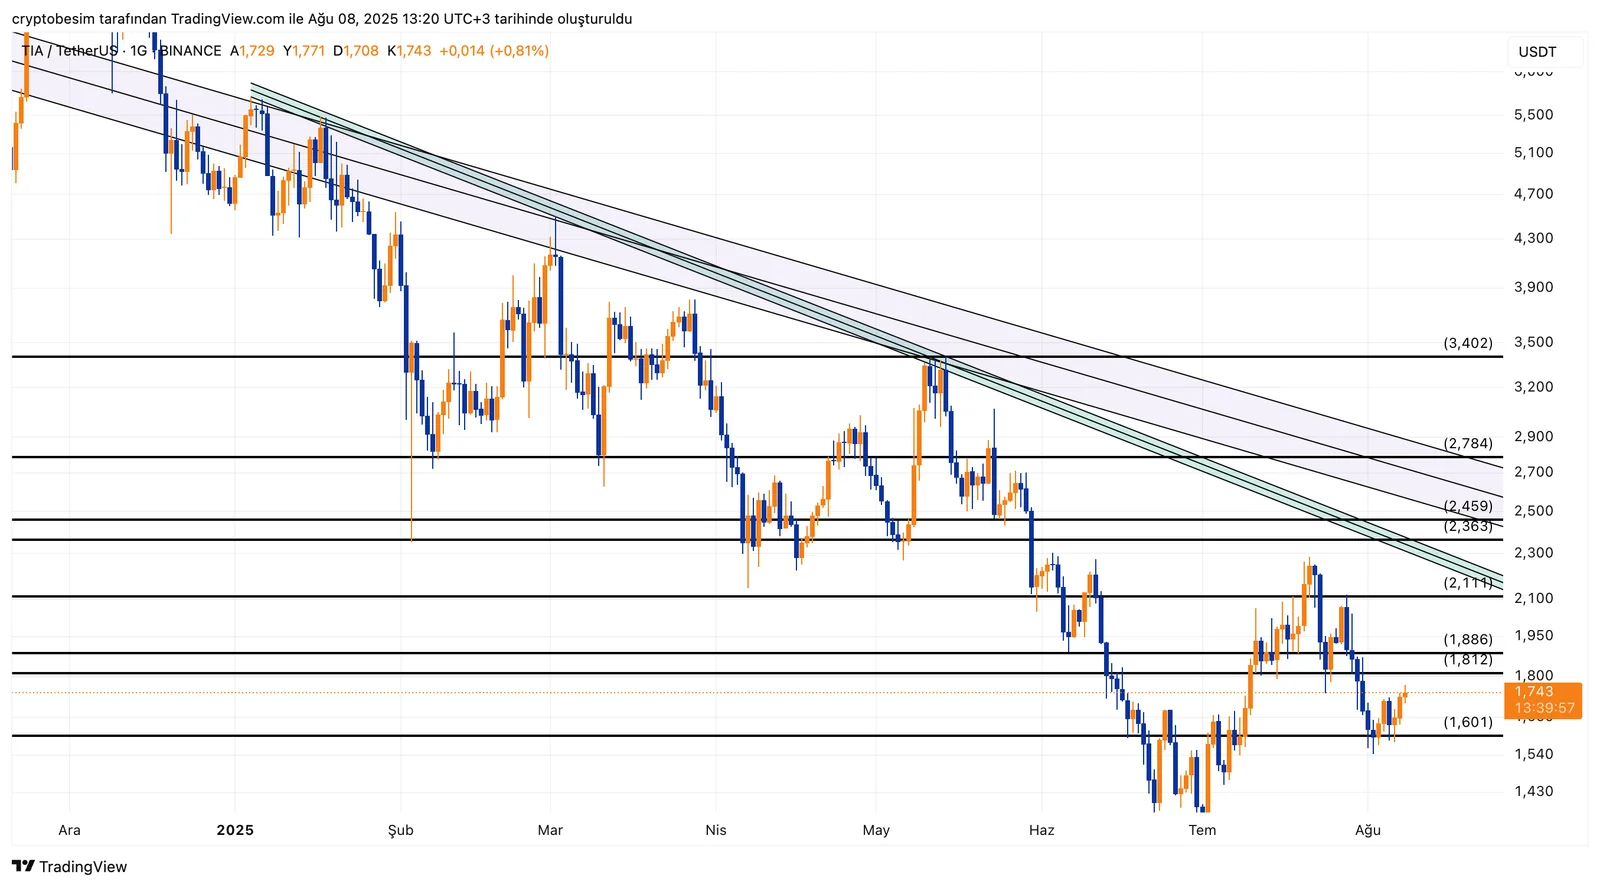
The downtrend structure remains dominant on the TIA chart. The price was once again rejected at $2.11, leading to a retreat, and is currently trading around $1.743. This pullback indicates that the recent short-term upward attempt lacked strength.
The $1.81–$1.88 range is now serving as resistance. As long as this zone remains unbroken, upward momentum may stay limited. A retest and breakout above this range would bring the $2.11 level back into focus as a critical threshold. A confirmed move above $2.11 could open the way for targets at $2.36–$2.45, followed by $2.78.
On the downside, the first support stands at $1.60. A break below this level would make $1.43 and $1.31 the next technically significant areas to watch.
Summary:
Current price: $1.743
- Resistance zones:
→ $1.81 – $1.88
→ $2.11
→ $2.36 → $2.45 → $2.78
- Support zones:
→ $1.60
→ $1.43
→ $1.31
This analysis does not constitute investment advice. It focuses on support and resistance levels that may present trading opportunities in the short to medium term, depending on market conditions. All trading decisions and risk management remain the sole responsibility of the user. The use of a stop-loss is strongly recommended for all trades mentioned.


