
SUI Technical Analysis
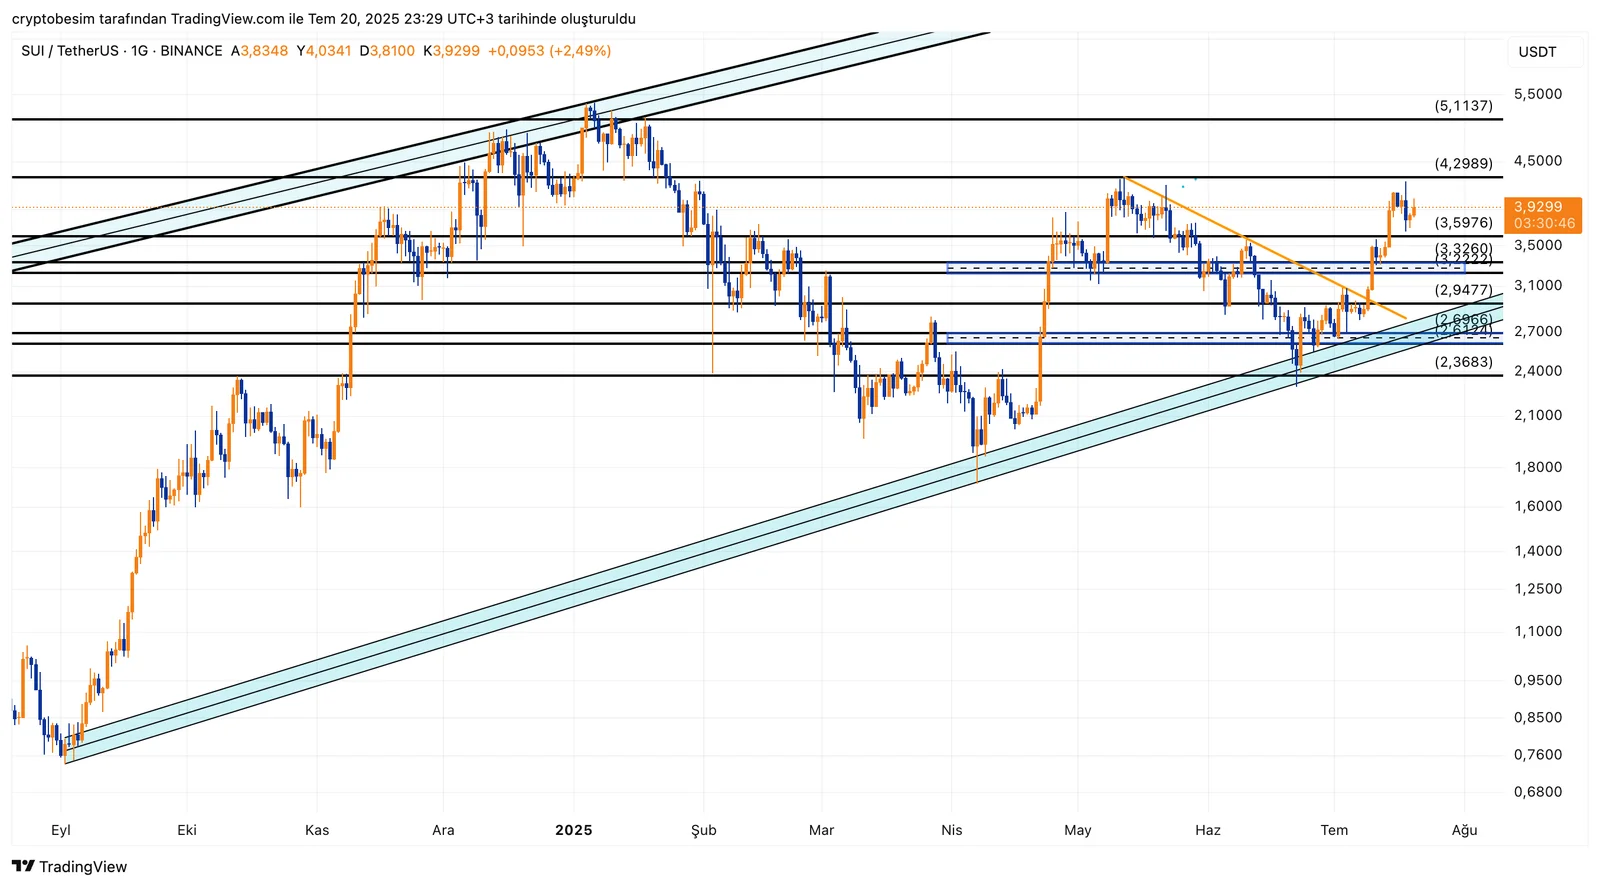
Looking at the SUI chart on a daily timeframe, we see that the price is trading within a wide-angle ascending channel. Currently, SUI is very close to the mid-border of this rising channel, suggesting a short-term accumulation.
It is clear on the chart that the price jumped sharply after the breakout of the falling trend in the short term. In other words, accumulation around the level of $2.70 resulted in an upward breakout, after which the price surged to the level of $4.30. We must add that this level worked as a strong resistance in the past. If the price can break above this strong resistance level, then it is highly possible that we should see a climb to the price range of $4.98–$5.11. However, we should bear in mind that the price must hold above $3.60 for such a rise, as this level is a previous resistance and a key level on the daily chart. We should be following the support levels of $3.22 and then $2.95 in case of a pullback. On the other hand, SUI could accumulate for a short period if it continues trading between $3.60 and $4.30. The breakout of this range is to determine the new trend for SUI.
Summary:
- SUI is trading close to the mid-border of the wide ascending channel.Short-term downtrend has been broken and the level of $2.69 stands as a strong support.The level of $4.30 works as a strong resistance.The range between $4.98 and $5.11 could be targeted if the price can hold above $3.60.$3.32 → $2.95 → $2.69 → $2.36 are support levels to follow in case of a pullback.The range between the levels of $3.60 and $4.30 can be considered as an accumulation zone.
These analyses, not offering any kind of investment advice, focus on support and resistance levels considered to offer trading opportunities in the short and medium term according to the market conditions. However, traders are responsible for their own actions and risk management. Moreover, it is highly recommended to use stop loss (SL) during trades.


