
SOL Technical Analysis
When analyzing SOL on a daily time frame, we can clearly see that the coin has been trading within an ascending channel pattern for a long time. In a wide perspective, the lower and upper borders of the channel still work properly. However, the price seems to be stuck within a narrowing range in the middle zone of this channel.It is clear on the chart that SOL tested the horizontal support level at $167.87, which, at the same time, intersects with a minor falling trend line. Thus, this level seems to be a strong support area for SOL, which is currently trading around $176.78 and is struggling to hold above it.
We could expect the upward movement to carry on if the price can hold above the level at $167. According to this prediction, we should be following the levels at $191.89, $201.24, and then $233.18 as possible targets ahead. The upper border of the channel corresponds to $300, and this level can be considered a medium-term target.We have the first strong support at $167.87 in the event of a pullback. Below it, we should be following the range between the levels $146.86–$140.03 as a key support zone. Moreover, if we see a deeper correction, the price could test the range $121.00–$122.00, which is a strong low level.
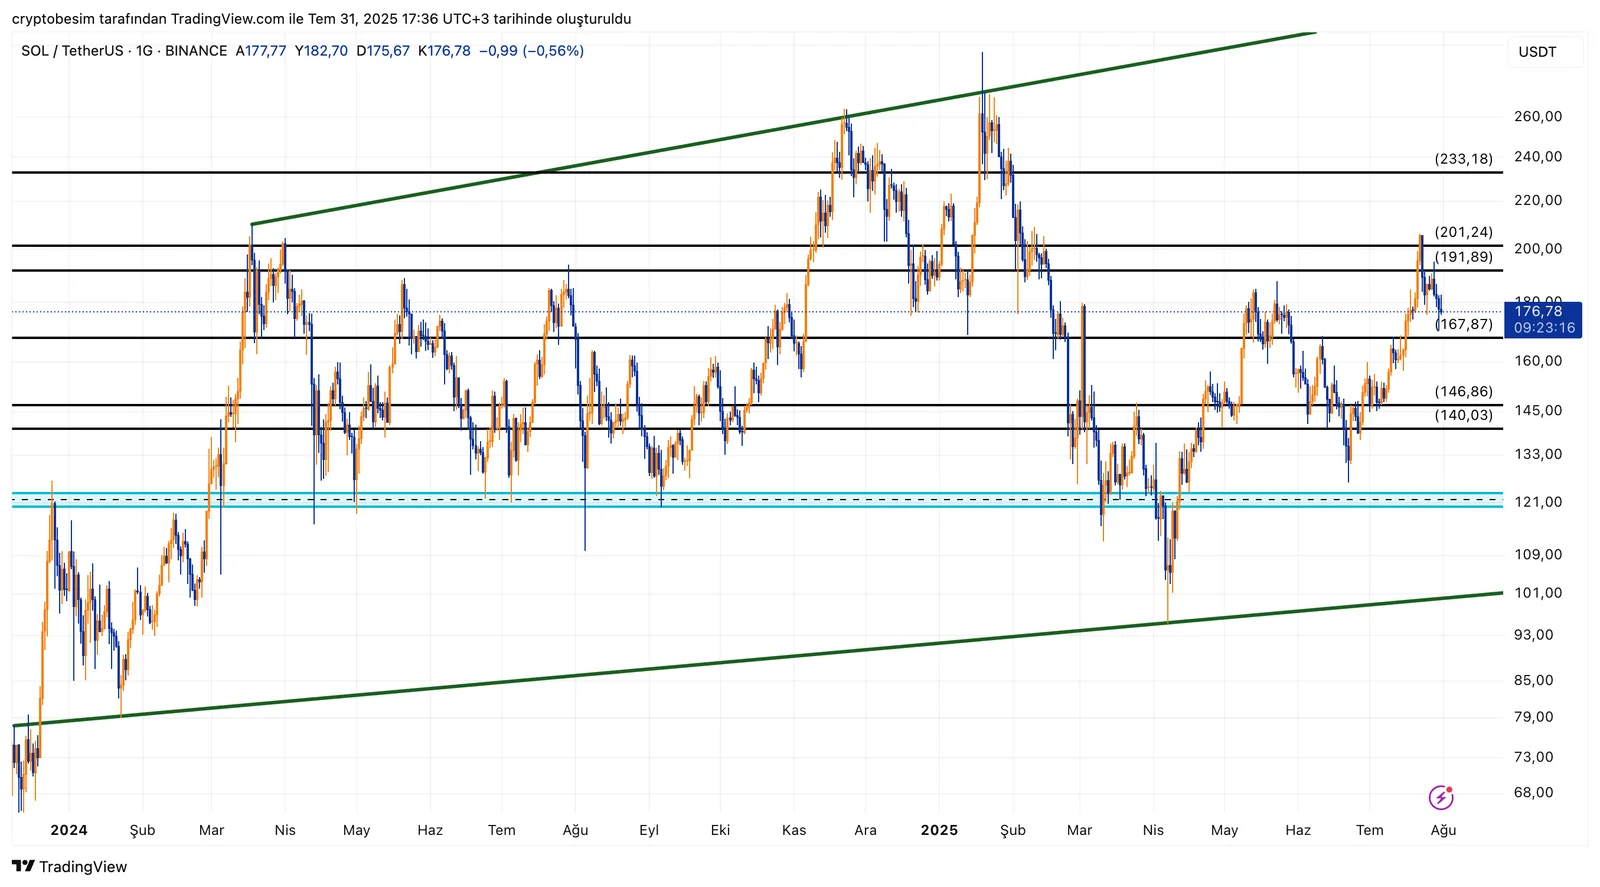
- Summary:• Price: $176.78, trading within an ascending channel structure• Horizontal resistance: $167.87 was broken, it is trying to hold above it• Upside targets: $191.89 → $201.24 → $233.18 → $300• Support levels: $167.87 → $146.86 → $140.03 → $121.00
Channel upper and lower borders are still valid, trend structure is maintained.
These analyses, not offering any kind of investment advice, focus on support and resistance levels considered to offer trading opportunities in the short and medium term according to the market conditions. However, traders are responsible for their own actions and risk management. Moreover, it is highly recommended to use stop loss (SL) during trades.


