SOL Technical Analysis
Solana has been trading within an ascending channel since the end of 2023. Looking at the broader picture, both the upper and lower boundaries of this channel have held effectively so far. Moreover, the price has recently been consolidating within a narrower range.
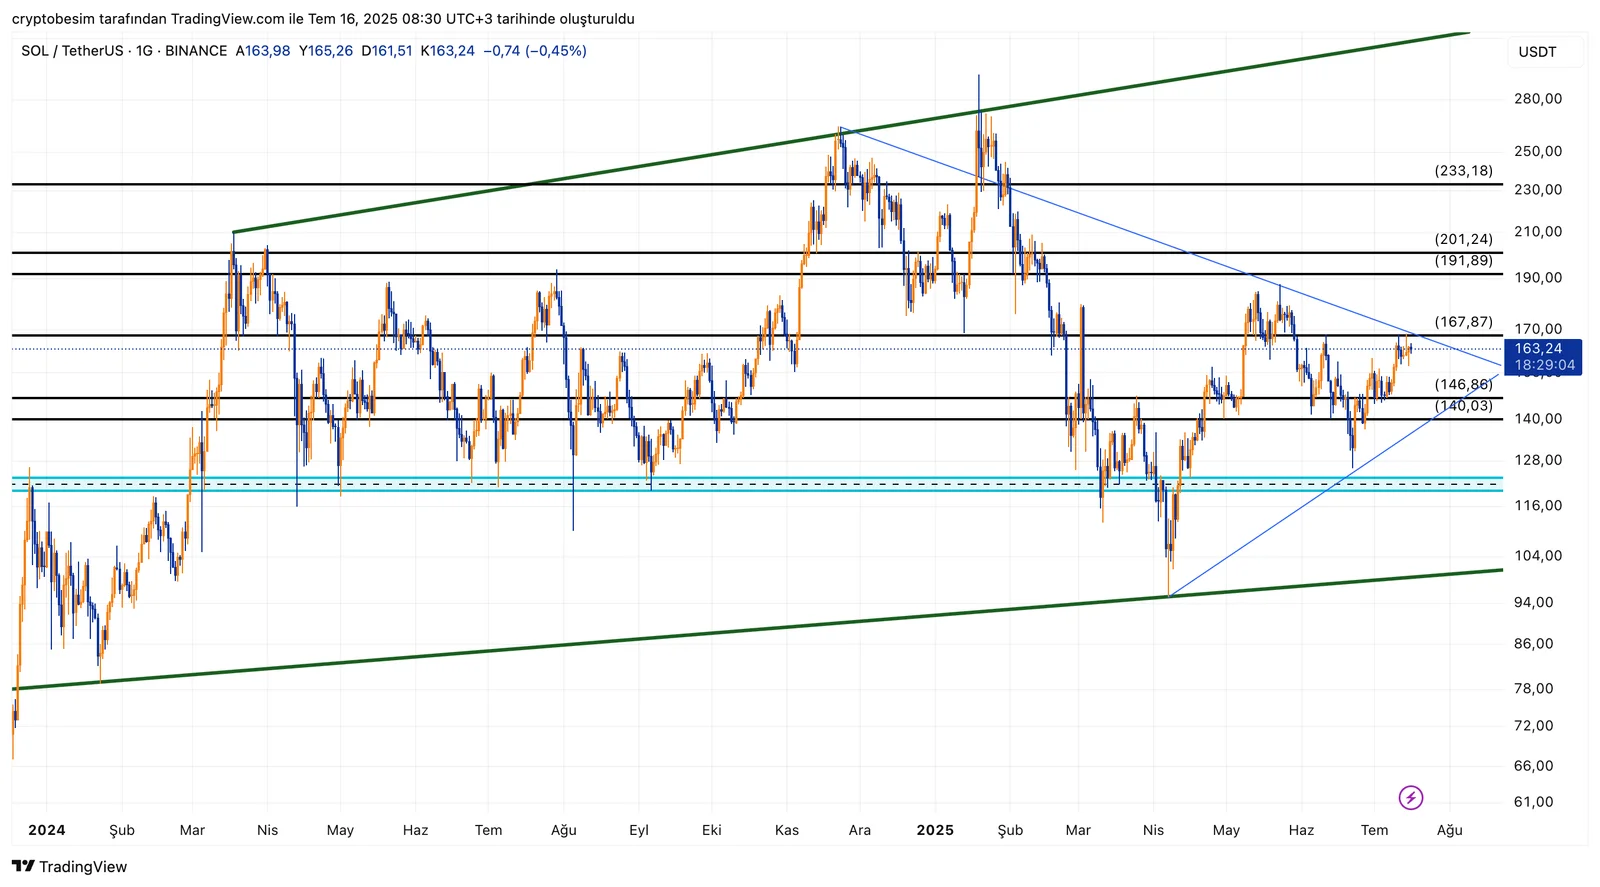
This horizontal pattern between $140 and $170 appears to be forming a triangle. A key horizontal resistance level lies at $167.87, which also intersects with a minor downtrend line. In summary, the price is approaching a critical breakout zone.
Currently holding above $163, Solana is attempting to break through this significant resistance. If daily closes are seen above $167, the following Fibonacci-based levels could be targeted:
- $201.24
- $233.18
- $300.00
These levels have previously acted as strong resistance zones.
In the event of a pullback, the immediate support levels to watch are $146.86 and $140.03. Below these, additional support lies at $128, with the strongest zone between $119 and $122.
As long as the ascending channel remains intact, a continuation of the bullish structure is expected. If resistance levels are broken with strong momentum, the $300 region could become a valid technical target.
These analyses, not offering any kind of investment advice, focus on support and resistance levels considered to offer trading opportunities in the short and medium term according to the market conditions. However, the user is responsible for their own actions and risk management. Moreover, it is highly recommended to use stop loss (SL) during trades.


