
Solana Technical Analysis
Looking at the (SOL) chart, it is obvious that it has been forming an upward trend pattern since the end of 2023. This uptrend pattern has a wide ascending channel, and the price of the coin is trading within the lower middle band of this ascending channel where the area of $119–$123 appears as strong support. We could say that the local bottom area may have been found if the price tests this support area and reacts upwards.
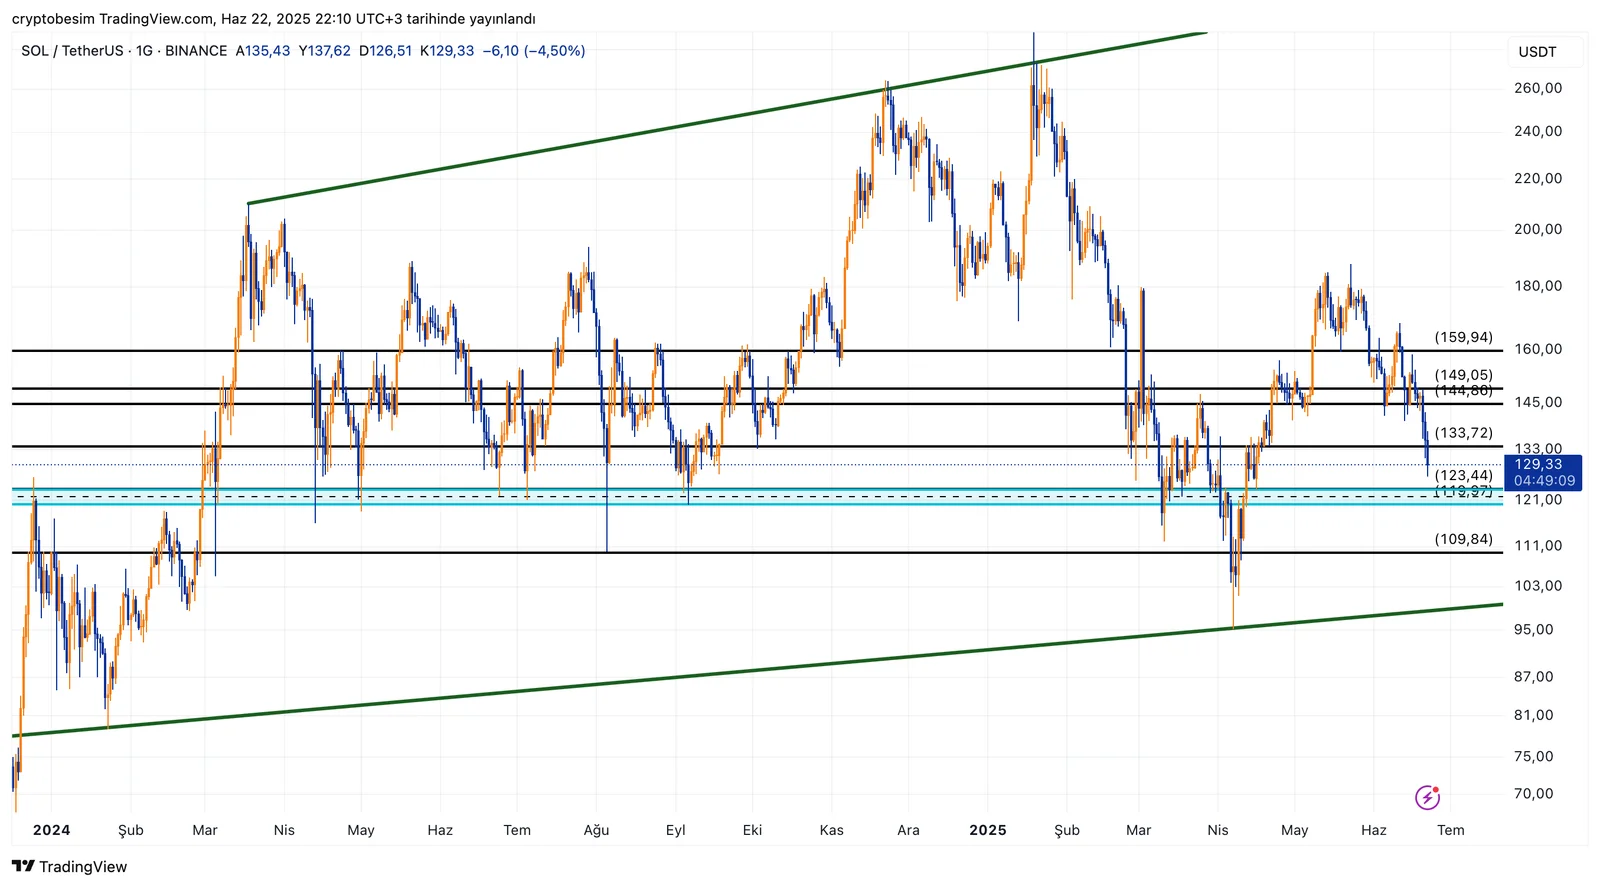
The price holding above this area will indicate that the price movement is a healthy pullback; however, if we witness daily closings below the level of $119, then the price may go down to the lower trend support step by step. Then the support levels $109, $105, and finally trend support $100 should be followed closely.
In case the price moves upwards, we can follow the levels of $190 again, and later $218, and finally the trend resistance level.
These analyses, not offering any kind of investment advice, focus on support and resistance levels considered to offer trading opportunities in the short and medium term according to the market conditions. However, the user is responsible for their own actions and risk management. Moreover, it is highly recommended to use stop loss (SL) during the transactions.


