
SEI Technical Analysis
When the SEI chart is analyzed on a daily timeframe, we see that the coin is still trading within the descending channel; yet, short-term price movements suggest that there is a potential towards the upper border of this falling channel. With the recent price rise, the coin tested the horizontal resistance at $0.3857 and then retreated.
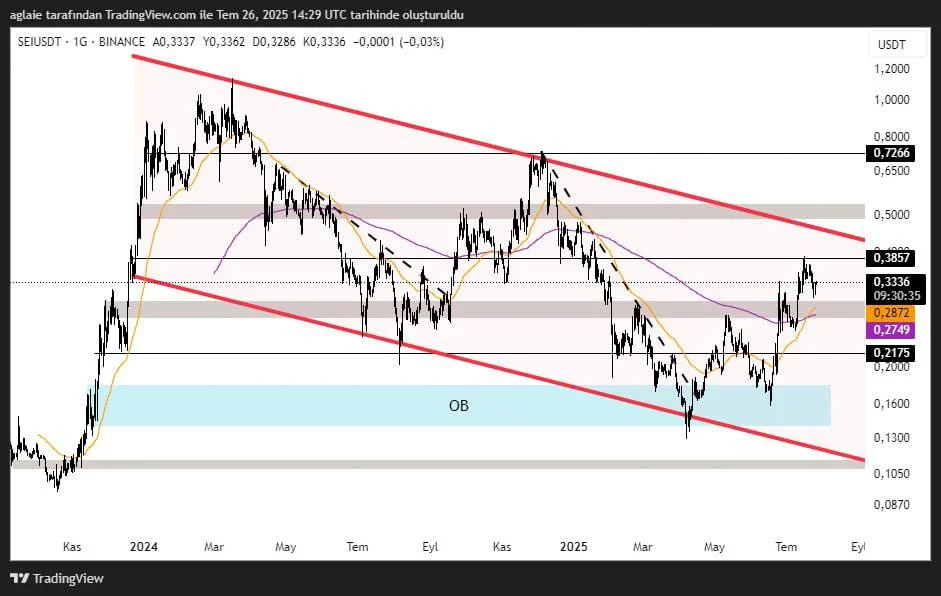
If we see a breakout above the resistance level of $0.3857 and a price closing above this level on a daily timeframe, the price could surge to $0.50. If there comes a breakout of the channel, the price could climb to the price range between $0.72–$0.73, which stands as a key area where the price previously saw sell pressure.
The range between the levels of $0.2983–$0.2709 is a significant support, as it serves as both horizontal support and a concentration of MA50 and MA200. If this support level gets broken, the drop in price could gain momentum, and it could retreat to the support level at $0.2175. The blue channel, which is below this level, is an OB (order block) zone, where strong buyers have historically stepped in.
These analyses, not offering any kind of investment advice, focus on support and resistance levels considered to offer trading opportunities in the short and medium term according to the market conditions. However, traders are responsible for their own actions and risk management. Moreover, it is highly recommended to use stop loss (SL) during trades.


