
RENDER Technical Analysis
Looking at the RENDER chart, it is obvious that the pattern is similar to the one we see on the ETC chart, namely a widening falling channel formation. We should draw attention to the support area of $2.83 - $3.13 in the horizontal support zones. The price of the coin, as obvious in the chart, quickly recovered after falling below this support zone and is currently trading above it. We are very close to the upper border of the channel for the time being.
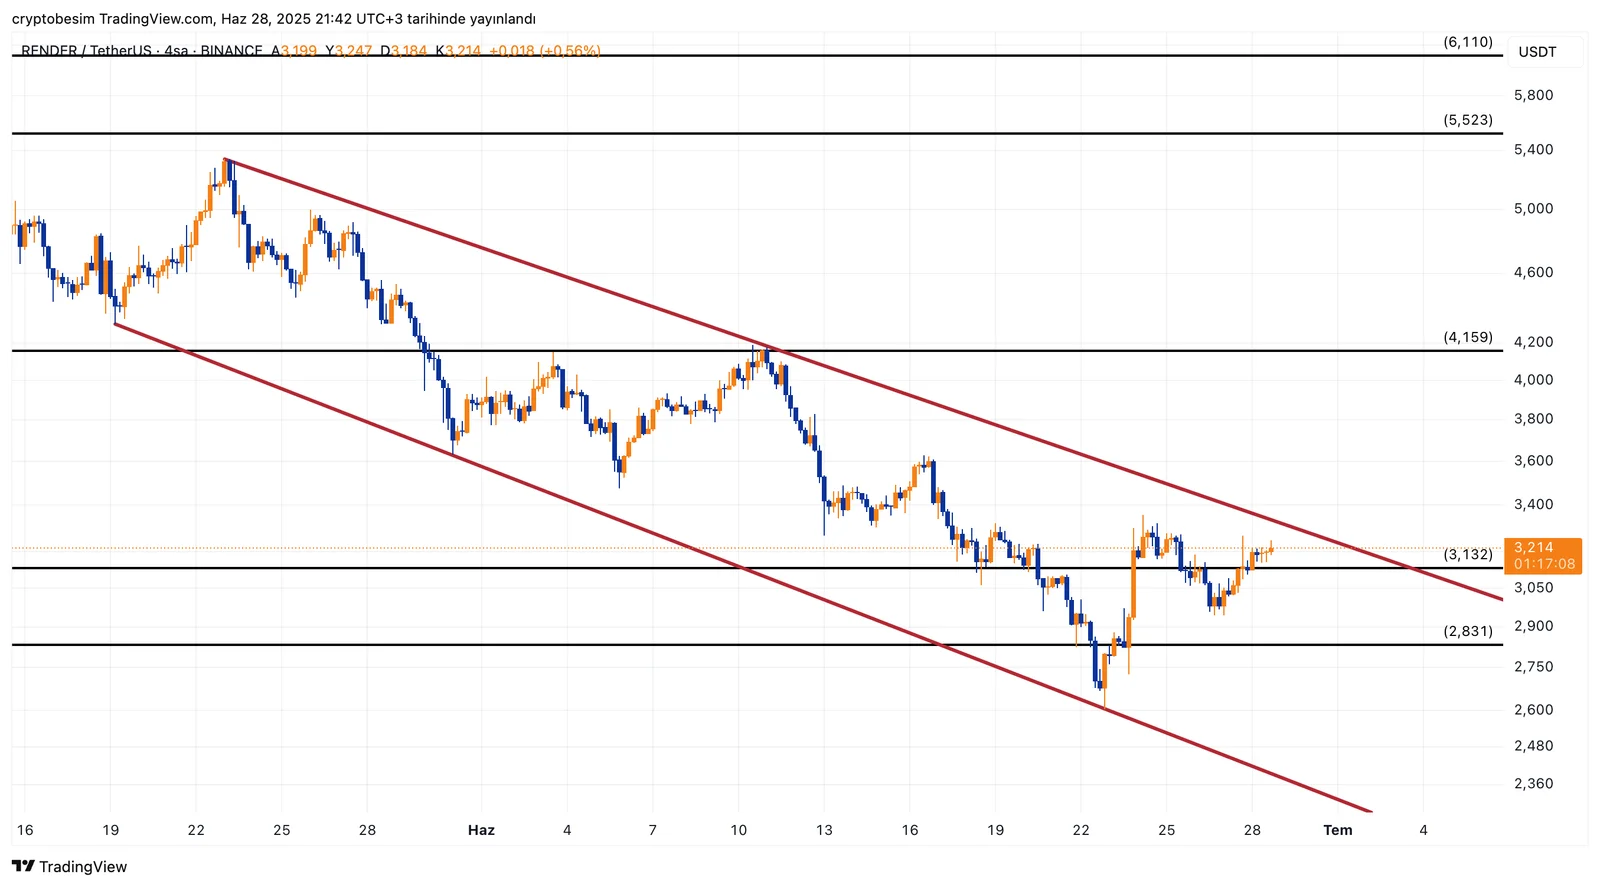
If we see a breakout above the support level, then the first main target will be $5.52 - $6.10, and below it we have a resistance level of $4.15 in the intermediate zone. The critical zone of $2.83 - $3.13 can play an important role in case the price pulls back after the trend test. The price might go down to the lower border of the channel, $2.40, if there come price closings below this area.
Will RENDER break out of the trend or pull back after the trend test is yet to be seen. The price will confirm its direction in the short term according to the scenario we lay out above.
These analyses, not offering any kind of investment advice, focus on support and resistance levels considered to offer trading opportunities in the short and medium term according to the market conditions. However, the user is responsible for their own actions and risk management. Moreover, it is highly recommended to use stop loss (SL) during the transactions.


