
PI Technical Analysis
When we analyze the PI chart on a daily timeframe, we can clearly see that it has still been trading within a descending channel. The strongest support level to watch is the price zone $0.40–$0.44, which served as a strong buy area in the past. If broken downwards, the price could drop to much lower levels, seeking a new low.
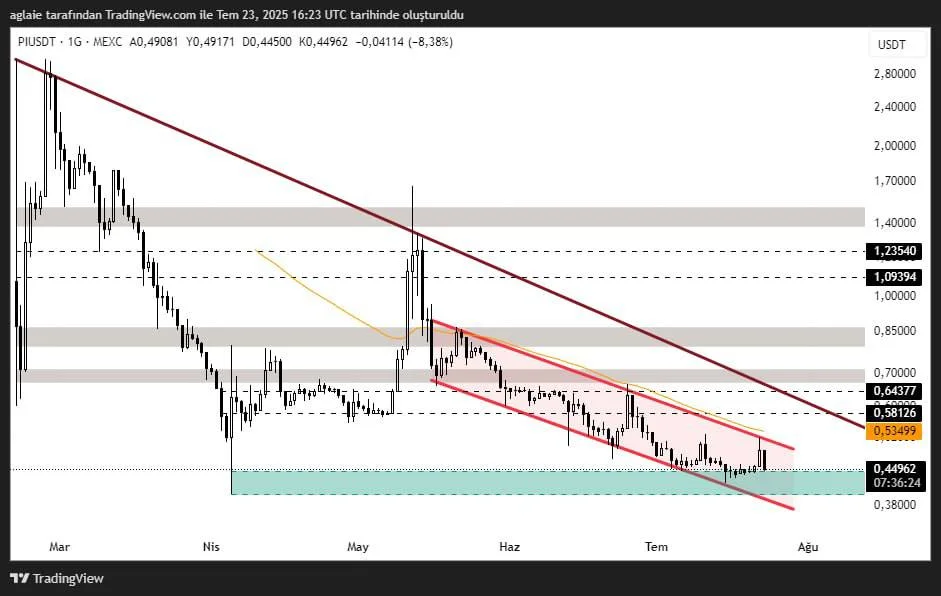
In a scenario where the price could surge to higher levels, the first resistance level the price will possibly test is $0.5349, which can be technically considered a key level as it intersects with the upper border of the descending channel. If this upper border is broken above, the price could gain momentum and surge to the levels of $0.5812 and $0.6437 respectively. Remember that the level of $0.640 is an area where the price saw strong sell pressure in the past.
In short, if PI manages to break above the channel, then it will be possible to talk about a medium-term trend reversal. If such a breakout occurs, the levels $1.0939 and $1.2354 could be the next price targets ahead.
These analyses, not offering any kind of investment advice, focus on support and resistance levels considered to offer trading opportunities in the short and medium term according to the market conditions. However, traders are responsible for their own actions and risk management. Moreover, it is highly recommended to use stop loss (SL) during trades.


