
PEPE/USDT Technical Outlook
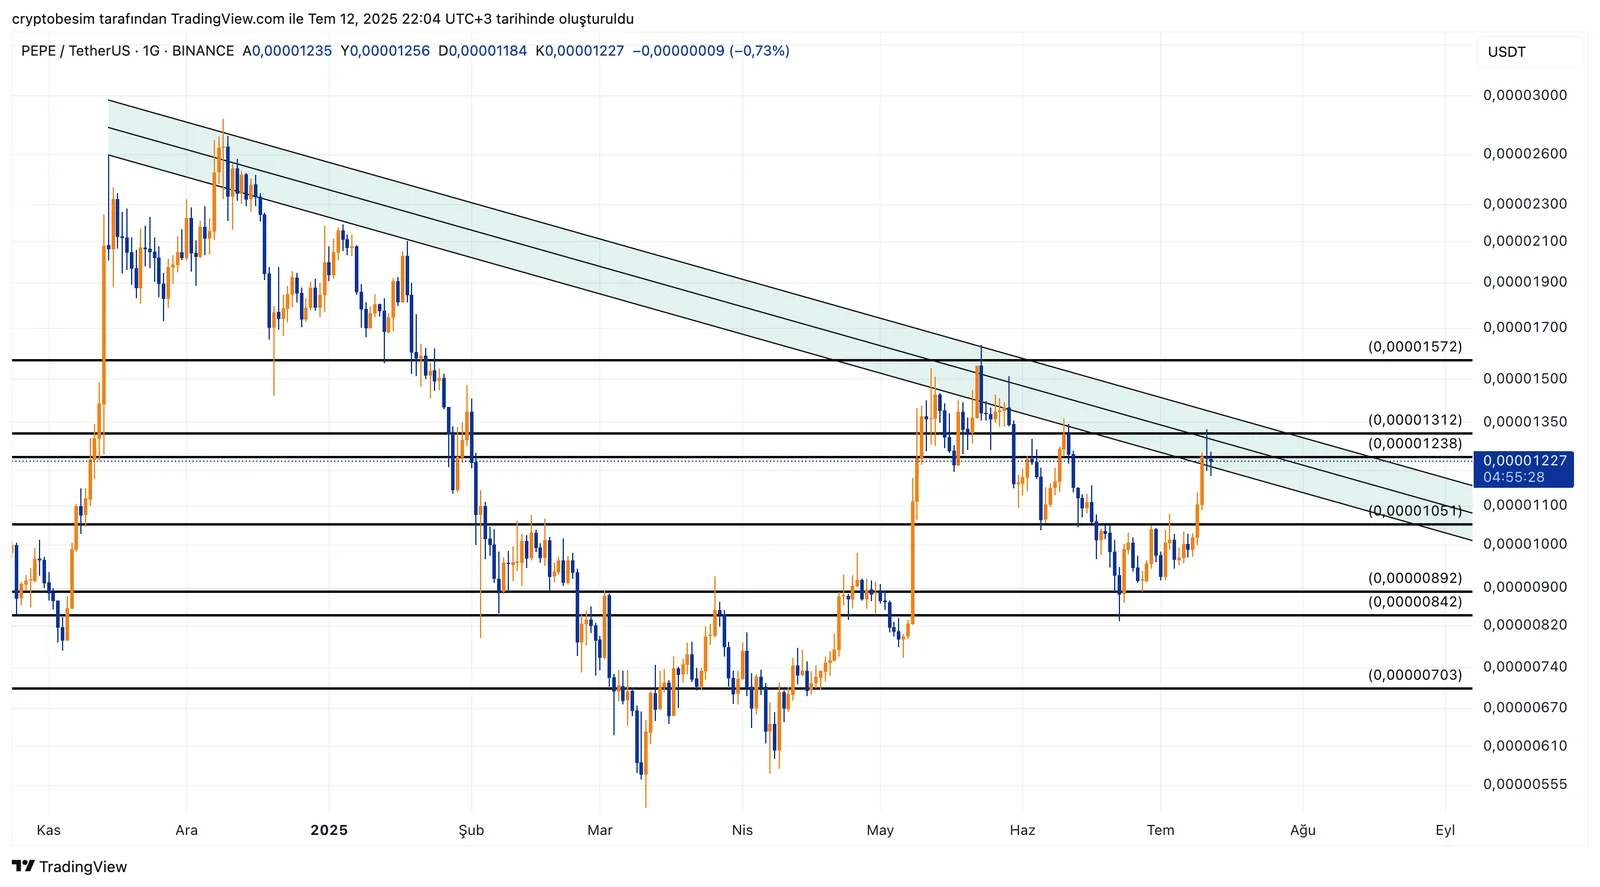
The pattern we have seen in the ADA and DOGE charts we analyzed today also appears in the PEPE chart. The downtrend, which started towards the end of 2024, is still in progress. The price of the coin has tested both the upper border of this descending channel and a key horizontal resistance area at $0.00001238. The price zone of $0.00001051 – $0.00001238 has worked as a strong resistance, which has been tested many times before. If this area gets broken upwards, the levels of $0.00001312 and $0.00001572 could be the next price targets on the chart.
$0.00001051 will be the first support the price might test in case of a possible pullback unless the mentioned breakout occurs. The liquidity area of $0.00000892 – $0.00000842 could hold the price if the first support level of $0.00001051 gets broken downwards. The current pattern may signal a trend reversal if it breaks out of the downtrend.
Summary:
- Downtrend starting at the end of 2024 is in progress.
- The price is both at the upper border of the trend and at horizontal resistance.
- If the price closes daily above $0.00001238, resistance levels of $0.00001312 and $0.00001572 will be the next targets.
- In case of a pullback, $0.00001051 and $0.00000892 will be the support levels.
These analyses, not offering any kind of investment advice, focus on support and resistance levels considered to offer trading opportunities in the short and medium term according to the market conditions. However, the user is responsible for their own actions and risk management. Moreover, it is highly recommended to use stop loss (SL) during the transactions.


