
PEPE Technical Analysis: Golden Cross or Death Cross?
On the PEPE chart, it is clearly seen that while the price of the coin is trading within an ascending trend, major technical indicators are giving clear signals. It is obvious on the daily chart that critical intersections like the Golden Cross and Death Cross have worked so far.
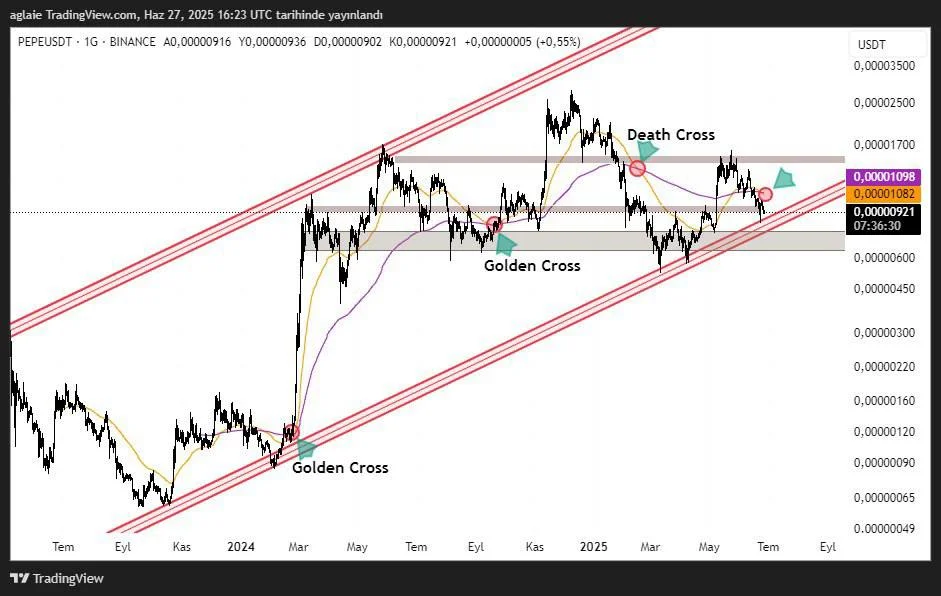
As it is clear on the chart, the price saw a strong upward momentum after the Golden Cross in 2024, but the Death Cross in early 2025 caused the price of the coin to fall significantly. PEPE is at an important intersection and is currently trying to find direction.
PEPE has tested the channel support and is currently coming closer to the horizontal support border, where buyers could be quite strong and could create a huge demand. If this is confirmed, then the first resistance level for an upward movement will be the $0.00000108–$0.00000110 area. If this area is exceeded, the price might rise up to the level of $0.00000170, the upper border of the channel.
However, if the support gets broken, the price may want to test the lower liquidity area of $0.00000075–$0.00000070 due to the Death Cross. In this case, both the channel pattern and the uptrend might be invalid.
These analyses, not offering any kind of investment advice, focus on support and resistance levels considered to offer trading opportunities in the short and medium term according to the market conditions. However, the user is responsible for their own actions and risk management. Moreover, it is highly recommended to use stop loss (SL) during the transactions.


