
PEPE Technical Analysis
The PEPE chart has a clear falling wedge formation, and the price of the coin is currently trading around $0.0000111, which is in an area very close to the lower trend band of the wedge. The price has reacted from the lower trend and could stay above the support level of $0.0000108.
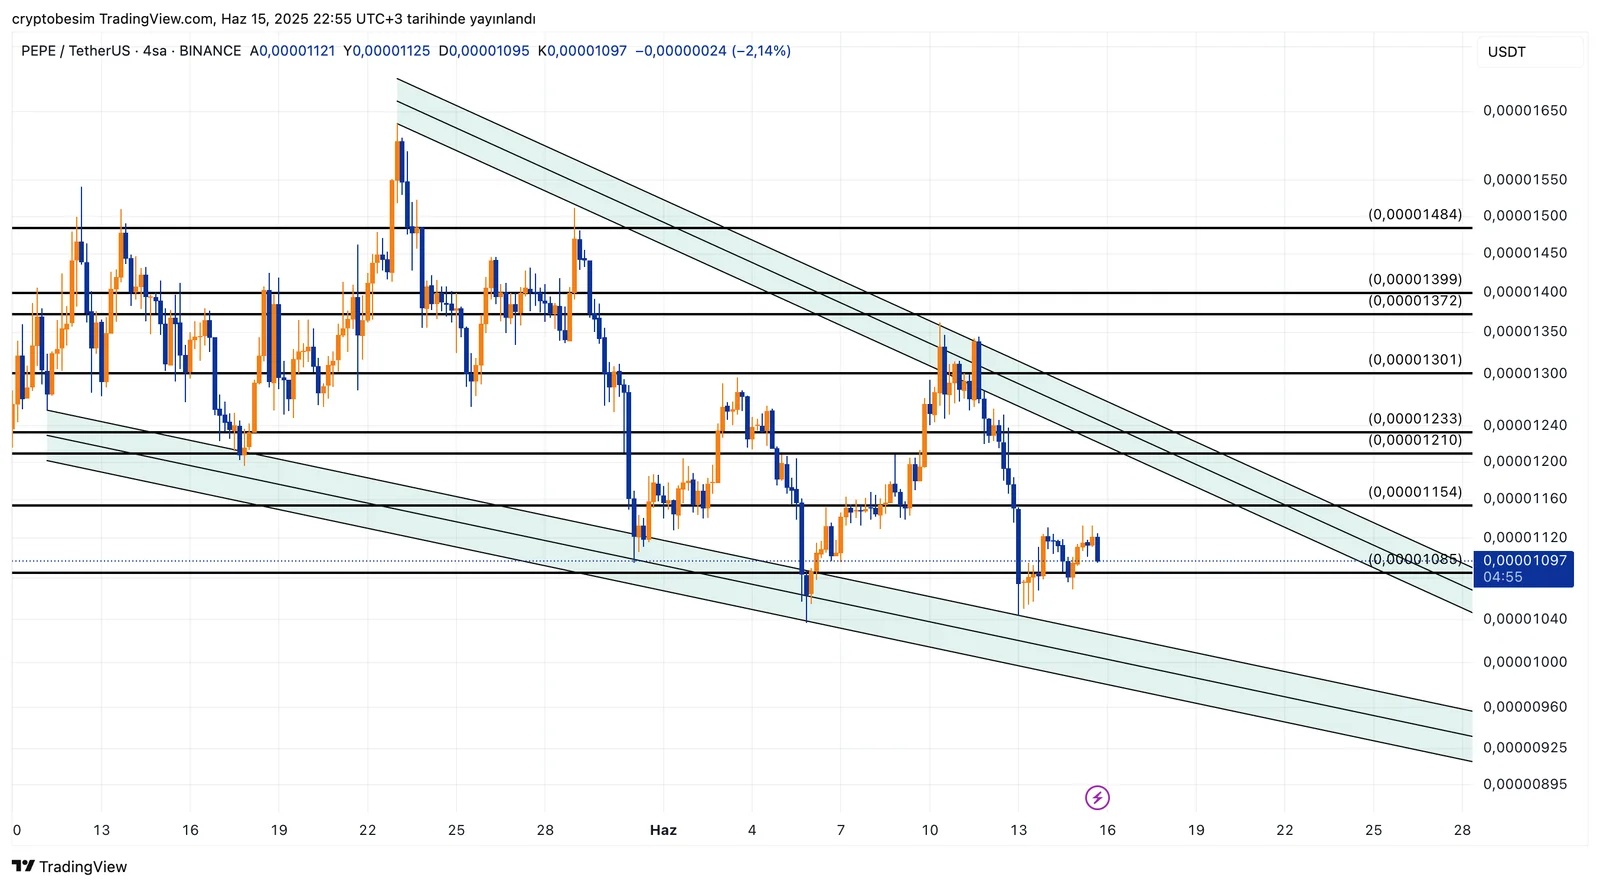
It is widely accepted that the falling wedge formation is typically a pattern with an upward breakout target. Buyers are strong below, but the number of contacts with the upper region is fewer than the lower region of the wedge. Therefore, if the price can go above the resistance level of $0.0000121–$0.0000123, the falling wedge formation could break out, and $0.0000163 can be targeted afterward.
However, should this falling wedge formation break down, the levels $0.0000099 and $0.0000087 can be followed.
These analyses, not offering any kind of investment advice, focus on support and resistance levels considered to offer trading opportunities in the short and medium term according to market conditions. However, the responsibility for making transactions and risk management belongs entirely to the user. In addition, it is strongly recommended to use stop-loss (SL) in relation to shared transactions.


