
Optimism (OP) Technical Analysis
At the OP chart, the price is under the descending trend for a long time. Now, we see that the price is now touching the liquidation area, which we see as the red channel at the bottom. That means OP can break the descending trend in the short term.
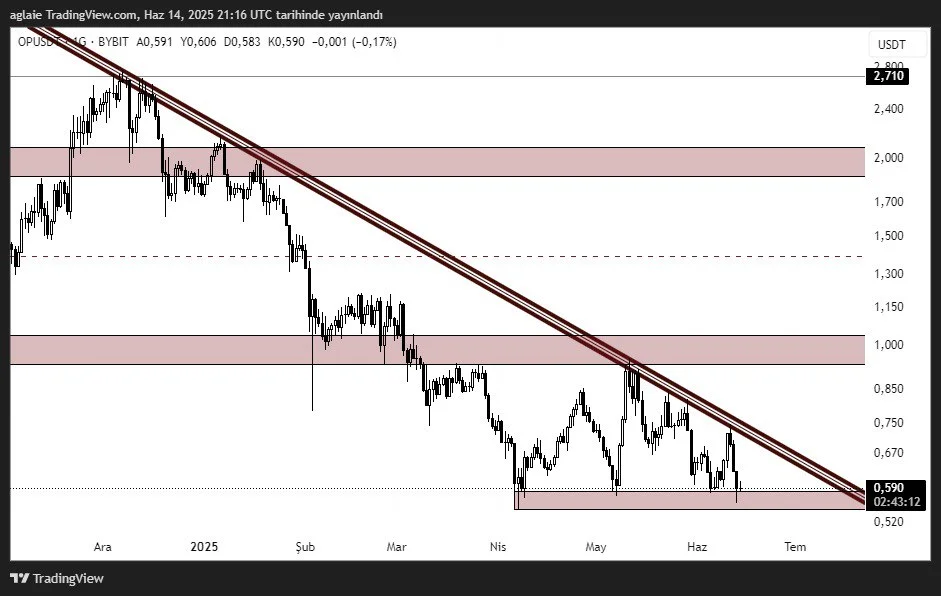
As we can see on the chart, $0.585–$0.600 is working as a strong support area. The price went up after touching this area, but after it went up, it was rejected by the descending trend line. So, OP is trading in a tight zone where both buyers and sellers are battling. Such structures usually break hard.
If we see an upward breakout, the first target could be $0.85–$1.00. This price area is technically a strong resistance. If the price stays above $1.00, the next target could be the $1.50–$2.00 price zone.
However, if the current support zone is lost, selling pressure for OP may increase, and there will be a pullback to $0.525. This level is important both psychologically and as the last line of defense.
In summary, the decisive moment for OP is approaching. If the downtrend is broken, a strong reaction is possible. But if the support is broken, we may see new lows.
This analysis does not constitute investment advice. It focuses on support and resistance levels that may present potential short- to mid-term trading opportunities depending on market conditions. However, all responsibility for trading decisions and risk management lies entirely with the user. The use of stop-loss orders is strongly recommended for any trade setup shared.


