
OMNI Technical Analysis
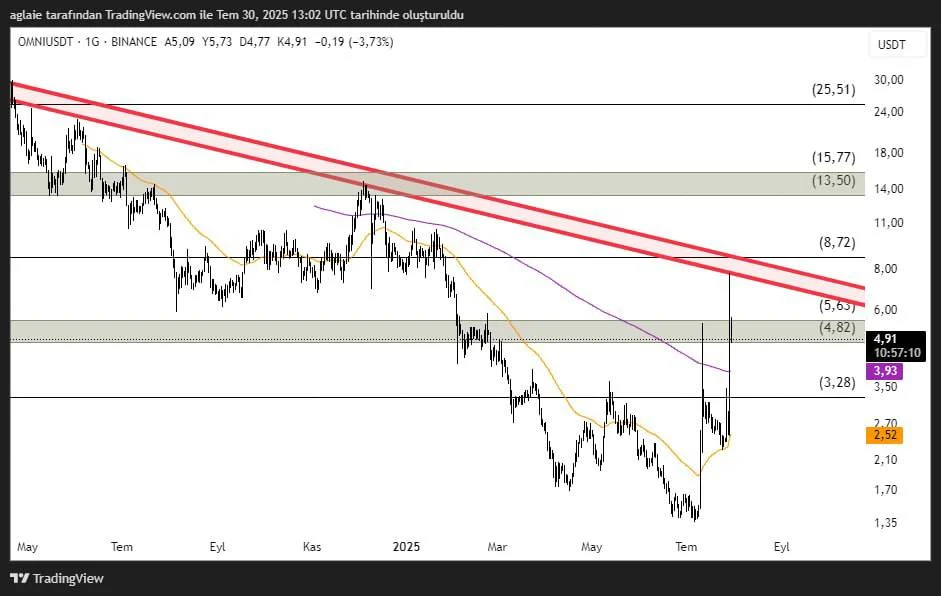
Analyzing the OMNI chart on a daily time frame, we see that the price retreated to the level at $3.28 and below it at first, and then it gained strong momentum and surged to the level at $8. As a result of this huge momentum, OMNI tested the upper end of the trend, yet it saw a sell-off there and pulled back to the range between the levels at $4.80–$4.90.
The range between $4.82–$5.63 stands as a strong resistance zone, and for the time being, the $5.63 level in particular is about to be tested. If the price can close above this resistance level and hold above it, we could see renewed buyer interest. We have the strong support level at $3.28 below; if broken downwards, the price is likely to pull back to the range between the levels $2.70–$2.50. This area also contains the previously tested bottom dynamic.
These analyses, not offering any kind of investment advice, focus on support and resistance levels considered to offer trading opportunities in the short and medium term according to the market conditions. However, traders are responsible for their own actions and risk management. Moreover, it is highly recommended to use stop loss (SL) during trades.


